Yves here. While this argument about marginal propensity to consume may seem a bit abstruse, it’s at the core of whether, in economic terms, it is productive to have people other than the rich have decent levels of income. Or to state the thesis in a more technocratically-acceptable manner, whether lowering income inequality helps growth. The debate hinges on whether people with lower incomes actually are spending more than people with higher incomes. As obviously as the answer might seem (how can rich people have lots of financial assets if they aren’t spending everything they earn?), as this post by Steve Roth shows, Jared Bernstein appears to have muffed the analysis.
By Steve Roth. Originally published at Angry Bear
I’ve said many times: every economic assertion should be preceded by the words “by this measure.” For big economic questions, you need to look at lots of different measures, lots of different way, to get a feel for what’s going on.
This has come home to me as I’ve considered Jared Bernstein’s ongoing takedown of liberal beliefs regarding inequality, marginal propensity to consume (MPC), and economic growth — epitomized in this remarkably weak-kneed December 2013 paper for the (supposedly) liberal Center for American Progress.
Bernstein is a strong voice for progressive policies. But in this paper and widely elsewhere, he repeatedly pooh-poohs the MPC argument.
That argument briefly stated: poorer people spend a higher percentage of their income/wealth each year, so if income and wealth are less concentrated, more widely distributed, there will be more spending.
Even briefer: extreme wealth concentration strangles growth. I built a little model depicting that arithmetic effect here.
But Bernstein repeatedly points to certain measures suggesting that things don’t seem to have worked out that way. Even as inequality has increased over the last 35 years, real per-capita consumer spending has continued to rise:
Okay, by these measures (and with y axes tweaked to depict these measures in a certain way), the MPC argument doesn’t look like it’s been borne out.
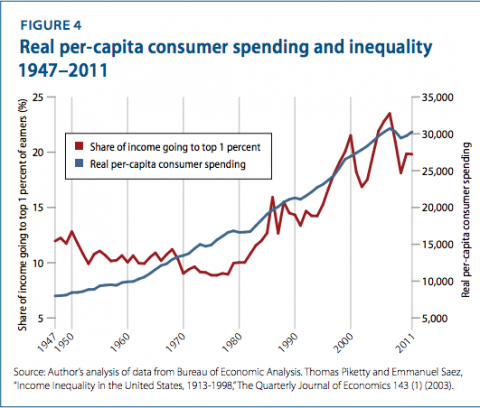
But even as he puts great weight on this display, he acknowledges that it isn’t very good evidence. You need a counterfactual: Sure, spending went up, but if inequality had remained the same, would it have gone up faster?
He attempts to answer that question with some regression analyses:
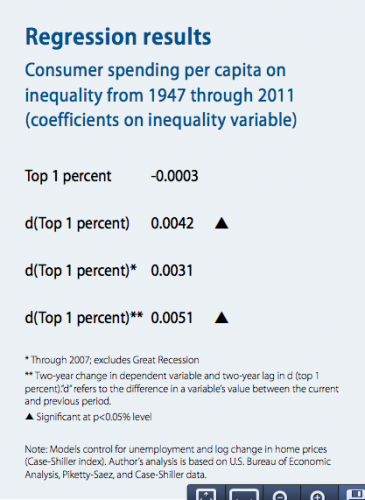
This is a rather impenetrable data display; read the adjacent copy* to understand it. But in brief, his regression-constructed counterfactual says that if equality had remained the same, there would have been less spending.
This seems to bear out the conservative narrative you’d expect to be hearing from AEI or The Heritage Foundation: greater inequality causes faster growth. (Presumably through “incentive” effects on “the most productive members of our society”?)
But statistical savants will see almost instantly that this counterfactual is weakly constructed, is logically tenuous at best. And what if we look at some other measures — especially measures of wealth, as opposed to income? Bernstein does make some attempt to include wealth measures in his regressions – Case-Shiller house prices and (rather oddly) unemployment. And he goes on to discuss the rise in consumer debt as a likely explanation for the spending growth. But skyrocketing debt — a (negative) component of wealth — is completely absent from these regressions, and he doesn’t look at wealth explicitly
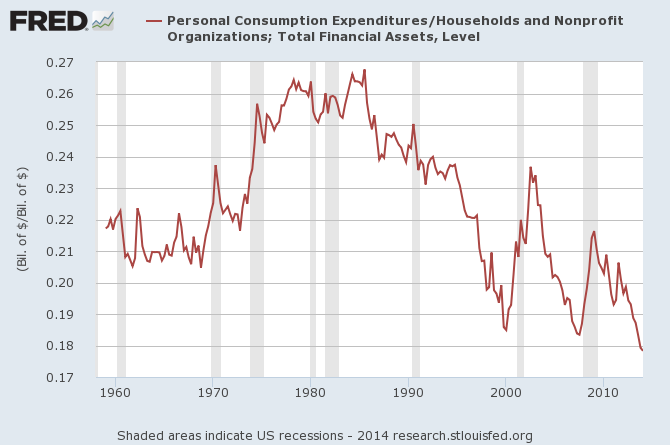
We have explicit measures of wealth. Here’s what consumption spending looks like relative to wealth over the last half century. Call this The Velocity of Wealth — how much of their wealth households turn over each year on purchases of newly-produced goods and services (the stuff of GDP). Click each graph to go to the FRED page.
Household Spending Relative to Household Financial Assets
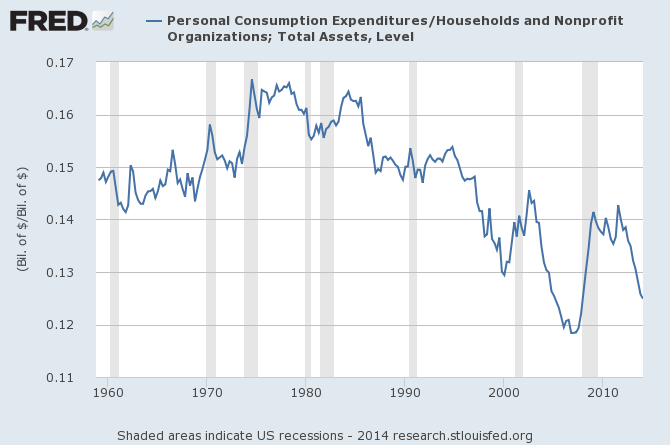
Household Spending Relative to Household Total Assets
Household Spending Relative to Household Net Worth (Total Assets – Debt)
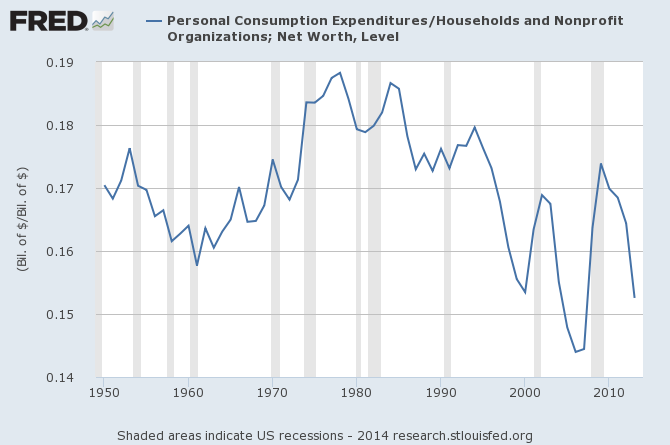
The last two measures are especially interesting because they incorporate home-equity wealth (which Bernstein tried to do, somewhat idiosyncratically, using a Case-Shiller variable in his regressions). And the last measure also incorporates household debt.
By all these measures, we see a massive, three-decade secular decline in spending relative to wealth over 35 years — the very same period over which we’ve seen massive growth in wealth inequality.
That’s exactly what the MPC argument predicts: as wealth concentration increases, the velocity of wealth declines. Ceteris paribus, more-concentrated wealth seems to result in less spending than more-concentrated wealth.
So what about the counterfactual? If wealth inequality had remained the same instead of skyrocketing, would we have seen these declines in wealth velocity? Some regressions might tease out some answers to that question. But given the apparent long-term nature of this effect, they’re going to have to include more than the rather arbitrary and singular, freshman-statistics-level two-year lag employed (only) in the last of Bernstein’s regressions. (The lag techniques Arin Dube used in his definitive and statistically sophisticated takedown of Reinhart-Rogoff’s 90%-debt foolishness seem especially well-suited to this work. Also take a look at these revealing if amateurish long-term cross-country regressions on wealth inequality and growth.)
So: more research needed. But that’s never stopped the conservatives from deploying their arguments, has it? One thing is certainly true: while that research is ongoing, it’s time for liberals to start taking their own side in this argument.
No names, just initials: Jared Bernstein.
* Update: The report PDF is one of those annoying ones that doesn’t let you copy large chunks. Have to read the description there.


I don’t think you need regression analysis to debunk obvious propaganda. Moreover, income redounding to the 1% is increasingly being captured by the top .01%, which makes the stagnation problem much worse. There is a vast difference between 3 million people doing well and 30,000 people grabbing everything.
Figures don’t lie, but liars figure.
I actually see the 1% meme as a dangerous, since it moves/hides targets. Don’t know about US, but in the UK doctor with his own practice is likely to be in the 1% income (median before-tax income is about 100k). Hey, a two-earnerrs family in London (and Edinborough) in mid-managerial roles (project manager) will be in 1% of income. A Londoner with 20kGBP annual income may be in 1% of wealth with a 3 bed terrace house the grandad bought 50 years ago.
Neither of them though can extert control like Murdoch, Bob Diamond (when he still could) or others of similar ilk.
Wealth can buy you the control, but doesn’t have to (look at most of the sports stars). Control, on the other hand, can bring you the wealth. What you want to go for is those who control (or want to control).
I wonder: why do we need counterfactuals at all here? All we need to do is compare the (average) share of (average) income spent–in any given year or period of years– on the parts of each of a number of segments of the income scale–that of the top 1% (for example) and on the other hand, those in the next quartiles, 24.75% each, for example. Without any hocus pocus, we should discover that the top 1% spends a far smaller share of its total disposable (annual) income (comparing like with like, of course and with all manner of investments counted as “savings”) than any of the four lower sub-groups.
As for:
“Bernstein is a strong voice for progressive policies. But in this paper and widely elsewhere, he repeatedly pooh-poohs the MPC argument.”
The latter of the two remarks shows why the former of the two is–to put it kindly–highly debatable. I take the contrary case in any such debate. For me, J.B. is worse than useless.
One could also survey the savings rates of each income cohort to discover the wealthy save a much larger share of their incomes.
We’d have to define “savings” carefully–just as we have to define “expenditures” carefully. If you buy and hold on to Rembrant paintings, have you “spent” or “saved” that part of your income? If you already have a principal place of residence and you buy a second–or third, fourth, fifth, etc.–home, is that counted as expenditure or savings? Comparing “things acquired and consumed, used up, exhausted”–like food, clothing, medical care, travel, family and home care, incidental costs of working and purchases of a durable good (cars, appliances) which are necessary replacements for previous articles worn out, are the sorts of things I’d count as consumption-expenditures.
You’re absolutely right that collectibles are problematic in discussing spending. As is real estate. So even “spending” is a somewhat elusive accounting concept/measure. But much less so than saving, which has the complications of both “income” and lending/borrowing.
You may find these interesting, from the excellent JW Mason:
http://slackwire.blogspot.com/2014/05/the-nonexistent-rise-in-household.html
http://slackwire.blogspot.com/2014/01/debt-and-demand.html
I would, solely in the interests of getting a rough idea, define saving as that portion of income placed in financial institutions for the purpose of preserving the principal. This would include time and demand-deposit accounts, securities, etc. I would not include goods subject to speculative pricing such as artwork or real estate; eliminating those, I strongly suspect the savings rate for the top 1% would run in the 20-30% range.
“income placed in financial institutions for the purpose of preserving the principal”
So we have to deduce people’s deposit intentions before we can call it “saving”? If your paycheck is deposited (*transferred*) automatically into your account, what portion of those deposits count as “saving”?
If your house or your stock portfolio goes up in value, have you “saved”? Have your “savings” increased? Have the household sector’s savings increased?
If you borrow $1,000 and don’t spend it, have you “saved” it?
Really, it’s an accounting concept you have to think very carefully about. It’s “flow entry” (as opposed to a stock) in accounting (actually a residual of two actual flows — income and spending), but it’s really a non-flow: you personal-save by not spending — leaving money sitting.
Spending is much less problematic, though still somewhat troublesome.
So we have to deduce people’s deposit intentions before we can call it “saving”?
Correct, psychology matters.
!!! While I certainly agree that economists should make much wider use of the experimental and survey methodologies that Kahneman and Tversky put to such valuable use, I very much don’t agree that measures absent such sources are useless.
It is useful to just look and see what people are doing out there, as long as careful attention is paid to the construction and implications of the accounting concepts.
Saying otherwise seems…
Typo alert: “Ceteris paribus, more-concentrated wealth seems to result in less spending than
moreless-concentrated wealth.”The easy question for Bernstein is where the money came from for the increase in consumer spending? Even if elite spending increased the denominator of three hundred million is so large that it would wash out the spending effect in the per capita number. The broad storyline of increased consumer debt and its effect on spending is illustrated here:
http://research.stlouisfed.org/fred2/series/CMDEBT The author gets to this implicitly through net wealth. The question not answered is Bernstein’s motive for that type of analysis?
…”masters” of the “arithmetic of ineffectiveness” and the “mathematics of delusion”…
I am not sure how Bernstein’s Figure 4 was constructed but it looks to me as though the right hand scale should probably be on a logarithmic basis (flattening the right hand side of the upward-sloping spending line significantly).
All (including Yves):
There’s no question that richer people spend a smaller percentage of their wealth each year than poorer people. That’s both empirically certain and (armchair) theoretically obvious.
The question is whether — and at what level — concentrated wealth impedes/strangles economic growth that would (have) arise(n) with more widely-distributed wealth.
Saving and savings are extremely elusive accounting constructs. I’ve written about this endlessly. NIPA’s “Personal Saving” is utterly different, for instance, from Household sectoral saving. This is related to the very problematic measures of “income.” Including cap gains? Unrealized or just realized? How about undistributed corporate profits? Should they be imputed to households? Tricky stuff to discuss.
And “saving” by the financial sector is an utterly befuddling concept.
Household assets, net worth, and spending, OTOH, and fairly straightforward measures. Why I use them.
Yes, looking at saving rates would show that the wealthy spend less of their wealth each year than the less-wealthy. But we knew that already.
@diptherio: thanks! Yves could you correct? (strike)more(endstrike)(underline)less(endunderline) I’ll do likewise elsewhere. Thx.
The question is whether — and at what level — concentrated wealth impedes/strangles economic growth that would (have) arise(n) with more widely-distributed wealth.
I would suggest this is a question for which the number and complexity of variables is so great one can never achieve an answer which approaches definitive, unless we redistribute incomes to see what happens. Barring that we’re (in my opinion) stuck at “the wealthy are taking a larger share of national income, spending less of that share and spending = employment incomes = output. Therefore lower spending = lower growth.
In the first chart of consumer spending/inequality adjusted for inflation? Because if it’s not, it’s meaningless.
I don’t think you’re right on that. As a ratio of nominal:nominal, it’s a perfectly useful measure of inequality. Real:real would be identical, assuming you use the same deflator for each.
> Or to state the thesis in a more technocratically-acceptable manner, whether lowering income inequality helps growth.
Because growth must be pursued at all costs? What is the point of society: to help people live fulfilling, meaningful lives or to sacrifice everything on the altar of embiggening an arbitrary number? Who devised the number, anyway, and for what purpose? If growth requires the povertization of most of the population and the destruction of the natural environment we require for life, why ought it be pursued? I submit that whatever this clown means by ‘growth’ is an objective evil, and both he and his ideas should be shunned.