Lambert here: So, it looks like Richistan had the right idea.
By Branko Milanovic, Visiting Presidential Professor, Graduate Center, University of New York and Senior Scholar, Luxembourg Income Center, and Roy van der Weide, Economist on the Poverty and Inequality Research Team in the Development Research Group, World Bank. Originally published at VoxEU.
Concerns about income inequality are ethical and political as well as economic. Ethically, rising inequality – particularly that in favour capital owners who do not labour for their income – is troubling. Politically, conflation of the rich and the powerful undermines democracy and the ‘background institutions’ that Rawls considered essential for a well-ordered liberal society.1 But for economists, it is the economic problems associated with inequality that are of first-order importance. Among those, none is more important than the effect of inequality on growth.
The link between inequality and growth (in that order) is one of the oldest issues in economics. In classical economics, high income inequality was justified by the need to have the rich who save a significant portion of their income, creating investment. In other words, as Max Weber (The Protestant Ethic and the Spirit of Capitalism) and Keynes (The Economic Consequences of the Peace) observed a century ago, the rich are supposed to be simply ‘receptacles for wealth’ or ‘saving machines’, receiving income but not enjoying it (through consumption). In the 1990s a large literature returned to the topic. Most of the work was cross-country, looking at how more and less equal countries’ growth rates varied (Forbes 2000, Li and Zou 1998, Barro 2000, Banerjee and Duflo 2003). The research essentially tried to find the connection between the second moment of the distribution of income (variance or another synthetic measure of inequality like the Gini coefficient) and the subsequent growth rate of the first moment of the distribution (growth of GDP per capita). The literature ended up producing few convincing results – the influence of inequality on future growth was found to range from positive (mostly for rich countries and over a short time horizon), to neutral, to negative (generally, over the longer-term).
One of the problems of that literature was that – partly because of a lack of micro data – it looked at the relationship between total measures of inequality and growth, which potentially overlooks important heterogeneities. Total income inequality is the result of many different factors; some of these factors may be good while others are bad for growth. A breakthrough came with attempts to ‘unpack’ inequality. Voitchovsky (2005) investigated the effect of inequality among the poor and inequality among the rich on GDP per capita growth. She found that inequality among the rich helps growth, and inequality among the poor hampers it. Further empirical evidence that inequality is built up of both good and bad drivers of growth has been obtained by Marrero and Rodriguez (2013).
Remarkably, all of the above mentioned studies focus exclusively on growth of average income or GDP per capita. This seems rather paradoxical. Measures of inequality summarize at any given point in time how incomes are distributed across the population. Yet when we investigate inequality’s relationship to future income growth we appear only interested in how it might affect growth of the average. One would think that we would specifically be interested in how individuals at different steps of the socio-economic ladder would fare in societies with different levels of inequality. The logical next step would be to unpack growth.
Unpacking Growth
In van der Weide and Molanovic (2014) we use large US micro-censuses that sample 1% (and more recently 5%) of households in each state, conducted every ten years since 1960, to answer the following question: how does state-level inequality among the poor and the rich in a given year affect state-wide growth rates of disposable income of the poor, middle class and the rich over the next ten years?
The half-century (1960-2010) which the data cover has been a period of substantial transformation of America’s economy and society.
- Labour participation rates among women – half of those of men in 1960 – became almost equal by 2010.
- The demographic structure changed. Non-Hispanic whites – who accounted for 85% of the population in 1960 – were only 65% in 2010.
- Education levels increased. The percentage of adults with bachelor or higher degree increased from 10% to 33%.
Above all stood a very important two-fold economic development:
- US per capita growth rate decelerated significantly, and growth moved from being pro-poor (with growth rates higher among the poor than among the rich) to being pro-rich (the reverse).
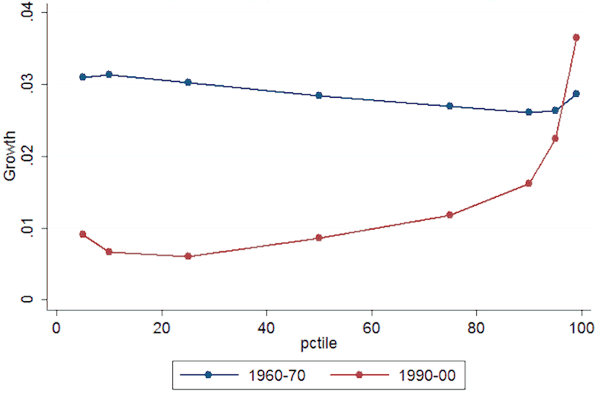
This change can be observed in Figure 1 – growth rates in the period 1960-1970 were higher than those in the period 1990-2000 for all percentiles of income distribution except the richest 1%.2 Note that this change plausibly represents an understatement; the very rich – the real top 1% – are not well captured by the data.
Figure 1. US: The average population-weighted state-level growth rates of real income at different points of the income distribution (decennial averages)
When we look at how state-level inequality is correlated with future growth rates at different percentiles of the income distribution across 49 states (leaving Alaska and DC, clear outliers, out of the analysis), we find a strong negative effect on the growth rate of the poor and an almost equally strong positive effect on the growth rate of the rich.3
Consider the following back-of-the-envelope analysis. The average state-level Gini coefficient in the US over the entire 50-year period is 0.43, with a standard deviation of 0.04. Now if a state’s level of inequality were reduced by four Gini points (about one standard deviation of the average) keeping everything else equal, the rate of growth of the very poor (people at the fifth or tenth percentile of income distribution) would increase by 0.9% per capita per annum (pc pa) on average. Since the incomes of the very poor on average grew by 0.8% pc pa, such a reduction in inequality wouldmore than double their growth rate on average. At the other end of the spectrum, the same decrease in inequality would reduce the growth rate of the rich (the top 5%) by 0.3% per capita annually. The rich’s average growth rate over the past half-century was 2% pc pa, so their growth would be cut by about one seventh.
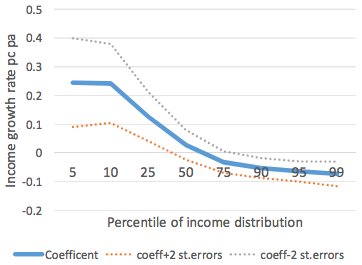
We find that overall inequality has almost no effect on the growth rate of the middle deciles – a finding which resonates with Palma’s (2011) argument that in both equal and unequal countries, the shares of the middle deciles (in Palma’s case, deciles five through nine) are almost the same. Figure 2 shows these results by displaying the effects of a one-Gini-point decrease in the growth rate along different points of the income distribution.
Figure 2. Change in the growth rate at different percentiles of income distribution due to a one-Gini-point decrease
 ” style=”height:265px; width:362px”>
When we also unpack inequality into inequality among the poor (bottom inequality) and inequality among the rich (top inequality), we find that it is mostly top inequality that is holding back growth at the bottom. Bottom inequality (when significant) also tends to lower growth among the poor, while it tends to help the growth rate of the rich.
Concluding Thoughts
How can these results be explained and what are their political implications? We are here reduced to hypotheses about the channels of influence since we cannot test them directly. One candidate mechanism that would be consistent with our findings is what we refer to as ‘social separatism’. It assumes that the rich, when inequality is high and their incomes are significantly greater than the incomes of the middle classes, prefer not to invest in public goods like education, health and infrastructure, but to consume them privately. This is the type of behavior observed among the rich in developing countries, most notably in Brazil (Ferreira 1995). However, the public goods that the rich are not interested to invest in are crucial for real income growth of the poor.
What are the political implications? If the current economic processes generating high inequality also help increase the future income growth of the rich, the question may be asked: why would the rich accept a policy that would slow their future income growth and thereby reduce their share of the pie? Is there a ‘public interest’ or a democratic (majoritarian) pressure that might convince the rich to accept such a policy change? Or are we just back to the observation made by Plato 24 centuries ago that communities with large inequalities “are not so much a single state as a collection of states”?4
References
Banerjee, A V and E Duflo (2003), “Inequality and growth: What can the data say?”, Journal of Economic Growth, 8(3), pp. 267-299.
Barro, R (2000), “Inequality and growth in a panel of countries”, Journal of Economic Growth, 5, pp. 5-32.
Li, H and H Zou (1998), “Income inequality is not harmful for growth: Theory and evidence”, Review of Development Economics, Wiley Blackwell, 2(3), pp. 318-34, October.
Ferreira, F (1995), “Roads to Equality: Wealth Distribution Dynamics with Public-Private Capital Complementarity”, LSE STICERD Theoretical Economics DP No. 95/286.
Forbes, K (2000), “A reassessment of the relationship between inequality and growth”, American Economic Review, 90(4), pp. 869-887.
Marrero, G and J-G Rodriguez (2013), “Inequality of opportunity and growth,” Journal of Development Economics, 104(C), pp. 107-122.
Palma, J G (2011), “Homogeneous middles vs. heterogeneous tails, and the end of the ‘Inverted-U: The share of the rich is what it’s all about”, Development and Change, 42, 1, 87-153.
Van der Weide, R and B Milanovic, “Inequality is bad for income growth of the poor (but not for that of the rich)”, World Bank Policy Research Working Paper, No. 6963.
Voitchovsky, S (2005), “Does the profile of income inequality matter for economic growth?”, Journal of Economic Growth, 10, pp. 273-296.
Footnotes
1 “Background institutions must work to keep property and wealth evenly enough shared over time to preserve the fair value of the political liberties and fair equality of opportunities over generations”, Justice as Fairness: A Restatement, 2001.
2 We do not show here the results for the most recent 2000-2010 period where growth across the entire distribution was practically zero as a result of the recent global crisis.
3 These results are essentially the same in the three econometric specifications that we use: pooled time series and cross-section regressions with regional fixed effects (four standard US regions: Northeast, South, West and Midwest), system GMM estimation (useful for dynamic panels like ours), and pooled regression with state-fixed effects. In all cases we use several demographic, educational, and labour force participation state-level controls.
4 The Republic, Part IV.


Speaking of inequality, why should the ability to repay and/or sufficient collateral make one company or person more worthy of the public’s* credit than another? It doesn’t. Creditworthiness does not apply when public funds or credit is involved, not if equal protection under the law is to be honored.
*via government privileges for private credit creation such a fiat lender of last resort, government deposit insurance, etc.
Welcome to the “Secret Scoring of America” and this will get worse as there’s a direct correlation to inequality with data mining and selling of personal data. This is all modeled and accomplished with models and algorithms, so pay attention to what’s going on out there as it’s growing. It’s data and technology you have no access to or say so on how it’s used, but it’s all data about you.
http://ducknetweb.blogspot.com/2014/06/data-selling-and-direct-correlation-to.html
Ruling in the UK, government will continue to sell medical records to health insurer as sharing for the good now has been replaced with sharing for the good money.
http://ducknetweb.blogspot.com/2014/11/sharing-for-good-all-but-disappears-as.html
If you want to learn more about how this occurs, take in some videos at the Killer Algorithms page where folks a lot smarter than me have taken time to let you know, that is if you want to know.
http://www.ducknet.net/attack-of-the-killer-algorithms/
There’s more information here is you want to read and maybe donate to the 3 year campaign to require all data sellers to be licensed so you know who they are when you have to go back and fix the every rising amount of flawed data that is on record about you at some point as you’ll be denied access to something and that’s how the wealthy becomes richer, we have no access and the algorithms just keeping moving the money in their direction.
http://www.youcaring.com/other/help-preserve-our-privacy-/258776
It’s expensive to be poor but especially so in spiritual matters – where eternity is at stake.
Btw, in the Old Testament, no fellow Hebrews but especially the poor, were ever to be charged any interest while in our society the poor are charged the highest interest, being less so-called credit worthy.
Now outlawing the private collection of interest is probably impractical but what is totally inexcusable is government subsidies for private credit creation since the latter drives up costs for the poor at the same time it cheats them of honest interest rates on their meager savings.
The increasing concentration of wealth in the hands of the already wealthy is a problem in many countries, not just the United States. About three weeks ago, Optimader pointed us to this important Credit Suisse document on the world’s wealth:
https://publications.credit-suisse.com/tasks/render/file/?fileID=60931FDE-A2D2-F568-B041B58C5EA591A4
On page 30, there’s a table that shows which countries have very high inequality, which is defined as the possession of more than 70% of a nation’s wealth by the top 10%. Among the developed economies, there are these: the United States (of course), Switzerland, and Hong Kong (it’s an “economy” although it really isn’t a country). Among the emerging market countries with very high inequality, there are Argentina, Brazil, Egypt, India, Indonesia, Malaysia, Peru, Russia, the Philippines, South Africa, Thailand, and Turkey.
To see which countries have “high inequality” or “medium inequality”, see the article. Belgium and Japan have very low inequality (top 10% own less than 50% of the country’s wealth); hurray for them, but I think it would be a lot better if the top 10% of a country owned (and controlled) less than 30% of the nation’s wealth.
This problem of a small elite owning everything is really quite easy to fix, as Lenin knew. It just requires bloody revolution.
Fixing it without bloody revolution is harder, and as far as I can tell was never successfully done until Woodrow Wilson.
Great article! It assesses the impact of overall inequality, as well as inequality among the poor and among the rich, on the growth rates along various percentiles of the income distribution. It finds evidence that high levels of inequality reduce the income growth of the poor and, if anything, help the growth of the rich. When inequality is deconstructed into bottom and top inequality, the analysis finds that it is mostly top inequality that is holding back growth at the bottom.