By Arthur Berman, a petroleum geologist with 36 years of oil and gas industry experience. He is an expert on U.S. shale plays and is currently consulting for several E&P companies and capital groups in the energy sector. Berman is an associate editor of the American Association of Petroleum Geologists Bulletin, and was a managing editor and frequent contributor to theoildrum.com. He is a Director of the Association for the Study of Peak Oil, and has served on the boards of directors of The Houston Geological Society and The Society of Independent Professional Earth Scientists. Originally published at OilPrice
U.S tight oil production from shale plays will fall more quickly than most assume.
Why? High decline rates from shale reservoirs is given. The more interesting reasons are the compounding effects of pad drilling on rig count and poorer average well performance with time.
Rig productivity has increased but average well productivity has decreased. Every rig used in pad drilling has approximately three times the impact on the daily production rate as a rig did before pad drilling. At the same time, average well productivity has decreased by about one-third.
This means that production rates will fall at a much higher rate today than during previous periods of falling rig counts.
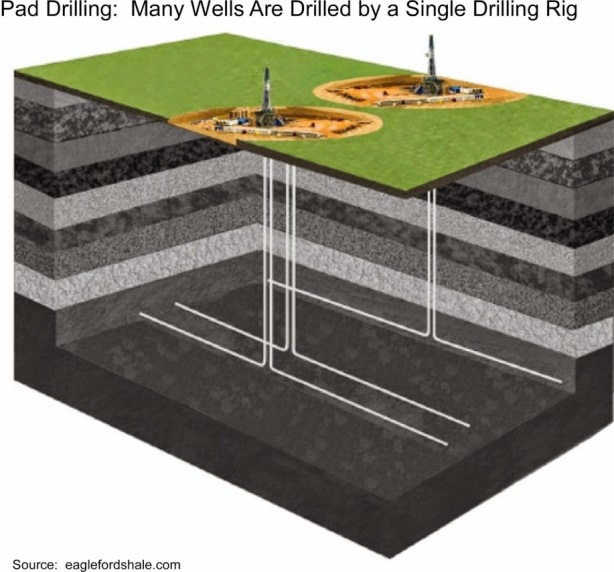
Most shale wells today are drilled from pads. One rig drills many wells from the same surface location, as shown in the diagram below
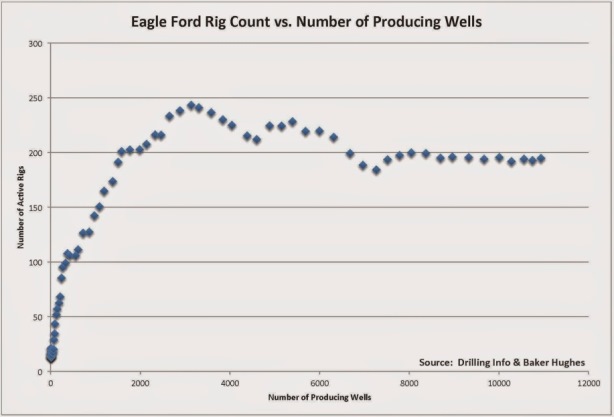
The Eagle Ford Shale play in South Texas is one of the major contributors to increased U.S. oil production. A few charts from the Eagle Ford play will demonstrate why I believe that the shale boom will fall sooner and more sharply than many analysts predict.
The first chart shows that the number of active drilling rigs (left-hand scale) in the Eagle Ford Shale play stabilized at approximately 200 rigs as pad drilling became common. The number of producing wells (lower scale), however, has continued to increase. This is because a single rig can drill many wells without taking the time to demobilize and remobilize. In other words, drilling has become more efficient as less time is needed to drill a greater number of wells.
The next chart below shows Eagle Ford oil production, the number of producing wells and the number of active drilling rigs versus time.
This chart shows that production growth has not kept pace with the rate of increase in new producing wells since mid-2012. That is because the performance of newer wells is not as good as earlier wells.
The final chart shows that the rate of daily production is now more dependent on the number of drilling rigs than on the number of producing wells. Rig productivity–the barrels per day per rig–has increased but average well productivity–the barrels per day per well–has decreased. In other words, production can only be maintained by drilling an ever-increasing number of wells.
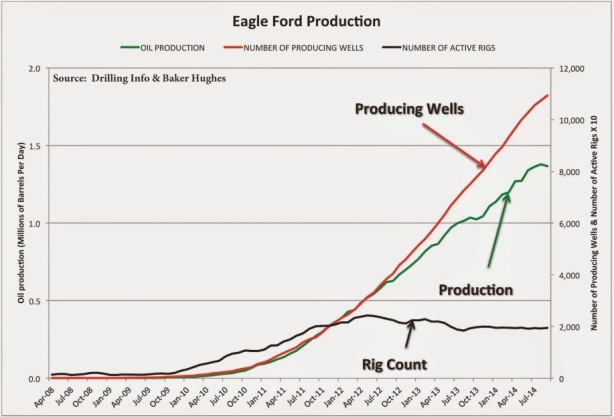
Average rig productivity has almost tripled since early 2012. Average well productivity has decreased by one-third over the same period. This means that every rig taken out of service today has more than three times the impact on daily production as before pad drilling became common.
Most experts do not anticipate any significant decrease in U.S. tight oil production in the first half of 2015. Their analyses may not have accounted for the effect of pad drilling and the decrease in average well productivity.
Using the Eagle Ford Shale as an example, U.S. oil production should fall sooner and more sharply than many anticipate. This will be a good thing for oil price recovery but maybe not such a good thing for the future profitability of the plays.


Interesting. According to bakerhughes web page, the rig count in Eagle Ford is slowly decreasing, Put the blame on earthquaques (¿related with so much drilling?). Lets suppose a total decline of 10% in rig count in January about (25/250). According to this post this would imply more than a 10% decline in production in february.
Well, the reduction in frbruary production should be a XX% depending on total well number and decline rate. Has anybody made these calculations?
Very interesting observations. I can’t help thinking that oil and gas production projections are so often wrong because the analysts are overwhelmingly economists rather than people with a proper science or engineering background.
I can’t help thinking that if the oil drop was part of a deliberate strategy by the Saudi’s, they would have agents ready to buy up mothballed drill rigs as soon as they are available in the market, and scrap them immediately. This would make it far harder for the industry to bounce back in the event of oil prices returning to three figures.
I wonder though if a sharp drop in shale oil production would really cause international oil prices to return rapidly. Because of refining bottlenecks on particular grades of oil I suspect that the impact would be less than expected – it would cause prices to rise in specific local US markets as demand rises for Gulf, Alaskan or other heavier grades, but I’m not sure it would have any impact on the price of Middle Eastern or Russian crude, as there is little direct overlap in those markets.
“I can’t help thinking that oil and gas production projections are so often wrong because the analysts are overwhelmingly economists rather than people with a proper science or engineering background.”
I can’t help thinking that oil and gas production projections are so often wrong because the analysts are grifters trying to scam gullible investors….
Think of the effort, “supposed” legal protections for the evaluation of securities, fiduciary and financial regulations, and than consider housing bonds.
Consider the MBS representations:
crafty
criminal
deceitful
devious
dishonest
dishonorable
double-dealing
dubious
fraudulent
illegal
indirect
iniquitous
nefarious
questionable
ruthless
shady
shifty
treacherous
underhand
unlawful
unprincipled
unscrupulous
untruthful
….
OH, and I forgot LYING!
Gotta love Barrie. Always putting people (since corporations are people) first.
http://www.nytimes.com/2015/01/27/us/politics/white-house-to-propose-allowing-oil-drilling-off-atlantic-coast.html?hp&action=click&pgtype=Homepage&module=second-column-region®ion=top-news&WT.nav=top-news
Sarah drill baby drill Palin would be proud.
Is there a mistake? The 2nd and 3rd graphs are identical.
Yes, that’s definitely a mistake, given the author’s description of what the 3rd graph is supposed to show (barrels per day per rig/well, not total barrels per day).
There was an extra chart, which was a duplicate. I didn’t strip out the link from the original post (which pulls the image off the OilPrice server, a bad protocol, since it makes the page slower to load and means the image will go poof if the source site stops operating or they remove the post from the Web, which can happen a few years out. Fixed.
I don’t mean to second-guess Berman, who has been an astute observer of the fracking scene, but decreased production was always to be expected from the second, third (or … tenth!) horizontal drilled from a pad. Initial horizontals should always be drilled toward the best proven reserve, so subsequent horizontals are ipso facto presumed to be suboptimal.
The big reason for the coming accelerated crash looks to be the Ponzi scheme: the asset value was grossly inflated. There was never as much oil down the hole as investors were promised, so to cover up this fact new horizontals had to constantly be drilled to support the illusion of boundless supplies. Now the financiers will have to sort out who holds the worthless paper and try to stick the taxpayers with the bad debt.
That’s not at all what that chart shows. According to the EIA, it is the complete opposite. The EIA graph shows that production growth probably peaked in 2012. This is probably explained by the axiom that ‘the lowest hanging fruit gets picked first’.
While Berman highlights the efficiencies of pad drilling, he doesn’t mention the lack of pad drilling in the Bakken and the Permian. The has been catching on but was not as common as it was in the EF or the shale gas play, the Marcellus. Also, I wonder Berman intentionally left out other factors such as completion backlogs and workover activity.
My brother in law was a team manager for Schlumberger until last week when he finally retired after 25+ years. He was given the option of early retirement or likely layoff, and chose the former. He was based in the Permian Basin and did a huge amount of work in the Eagle Ford. As you probably know, Schlumberger is the world’s largest oil field service company and they are in the process of laying off 9,000 US & Canadian employees. The big operators like them are always ahead of the little guys and shoestring operations, so you this is really just the beginning. His boss told him that ‘the numbers don’t work’, and we’re cutting expenses right now. At only $40+ per barrel, fracking in the US is effectively dead.
When is a Ponzi Scheme dead? The Banksters will need to keep the game of musical chairs going until they are comfortably seated and whoever they can pass the losses to are standing. Schlumberger is merely the first to sit. If one of the Banksters is not able to find a chair, the Fed will see that a chair is provided. Bet on it!
Is there a reason berman shows discrepant scales on axes of the graphs for units (wells, rigs) and MBPD?
Wells are 92% of the axis scale, but MBPD < 75%?
This is the nightmare of fracking: Confirmed: California Aquifers Contaminated With Billions Of Gallons of Fracking Wastewater.
http://www.desmogblog.com/2014/10/07/central-california-aquifers-contaminated-billions-gallons-fracking-wastewater
So for whatever reason, if fracking is finished, good riddance. Land becomes unusable without drinkable water.
Of course this article is from Oct 2014 and yesterday is the first that I heard of it.