By Markus Poschke, Associate Professor and William Dawson Scholar, McGill University, and Barış Kaymak, Associate Professor of Economics, Université de Montréal. Originally published at VoxEU.
Following the publication of Thomas Piketty’s 696-page tome, Capital in the Twenty-First Century, economic inequality is still at the forefront of public debate. In 2015, it has shifted its focus from the distribution of income to that of wealth, as new measures show that the wealthiest have claimed an increasingly larger share of total wealth in recent decades. In their study of US tax records, Saez and Zucman (2015) estimate the share of wealth owned by the wealthiest 1% of tax units (a concept close but not identical to a household) to be 42% in 2012, up from 28% in 1960 (see the blue line in Figure 1).
Figure 1. Top 1% wealth and income shares, 1960-2012
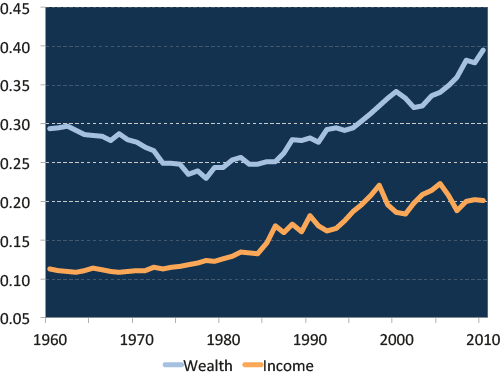
Sources: updated data files for Piketty and Saez (2003), and Saez and Zucman (2015).
Drivers of Wealth Inequality
A number of factors have been proposed to explain the surge in wealth concentration (see, for example, the recent VoxEU pieces by De Nardi et al. 2015, Kanbur and Stiglitz 2015). Much of the debate focused on changes in US tax policy as a major potential factor, as the effective tax rates on top income earners in the US have substantially declined in recent decades. The top marginal federal income tax rate was reduced from 91% in 1960 to 35% in 2010 (see Figure 2). Furthermore, lower rates of corporate and estate taxes, combined with more generous deductions and exemptions from these taxes, have disproportionately benefited top income groups (Piketty and Saez 2007).
Figure 2. Top marginal tax rates (left axis) and estate tax exemption (right axis)
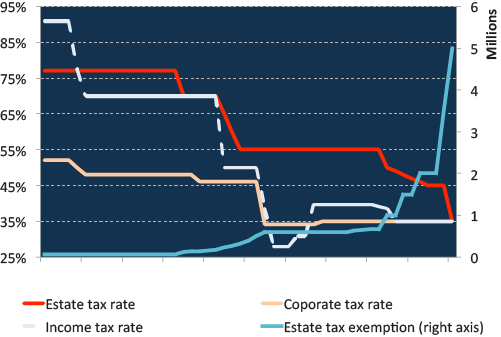
Sources: NIPA, Joulfaian (2013), IRS.
A competing explanation emphasises changes in the economic environment, particularly in production technologies, that favoured skilled workers and widened the wage distribution. In fact, the concentration of wages, earnings and income has increased by more than that of wealth during this period. The top 1% share of income, for instance, doubled from around 10% in the 1960s to around 20% in 2010 (see the red line in Figure 1). Unless top income earners reduce their saving, this almost directly translates into higher wealth inequality.
Another important and often overlooked third factor is the rise in the generosity of government transfers since 1960, mostly due to the expansion of public pensions (social security) and the introduction of public health insurance for the elderly (Medicare). Combined spending on these two programs accounted for almost 9% of US GDP in 2010, up from less than 3% in 1960 (see Figure 3). These government programmes tend to curb the need to rely on personal savings for retirement, especially among low and middle-income households, and might thus explain why their share in total wealth has declined.
Figure 3. Federal transfers to seniors (% of GDP)
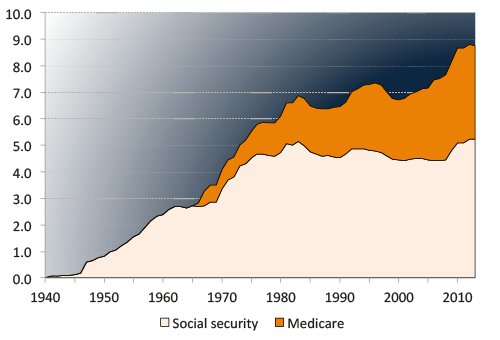
Sources: NIPA and SSA
A Quantitative Analysis
In a recent paper (Kaymak and Poschke 2016), we provide a quantitative analysis of how changes in taxes, transfers and in the wage distribution have affected the wealth distribution. Understanding the sources of wealth dispersion is an indispensable first step before inferring its implications for welfare and discussing the efficacy and desirability of policy responses. For instance, if the surge in wealth concentration is a result of tax and transfer policy, then it may be reversible – leaving only the question of desirability. Reversing the surge in wealth concentration would be much harder if it is driven by technological change. Moreover, even if it were reversible, it is not clear that it would be desirable. If the observed rise in wealth inequality is a result of more generous transfers, as opposed to top income tax cuts, then it would bring about lower consumption inequality.
We tackle this question using a quantitative model in which households differ in their earnings potential and wealth, and where future earnings are uncertain.1 Households in the model save for retirement, to leave bequests to their children, and as a precaution against adverse shocks to their income. Overall, the model provides a good representation of the distributions of income and wealth in 1960. In particular, it can replicate the high concentration of wealth, as well as the evolution of income inequality and the increasing contribution of labour earnings to top incomes between 1960 and 2010 (see Figure 4).2
The model economy can thus be used as a laboratory to study how households react to changes in policy and in incomes like the ones that occurred since 1960. Aggregating individual responses then shows us how aggregate economic outcomes and the wealth distribution evolve.
Figure 4. Top income concentration and composition
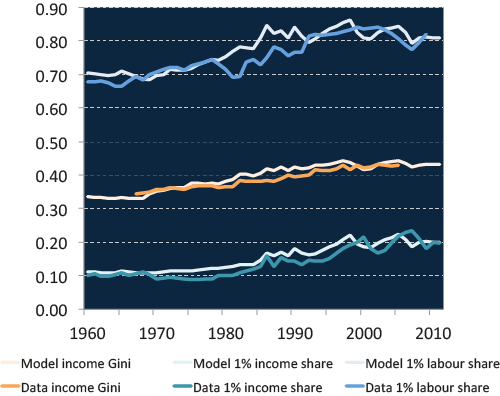
Sources: updated data files for Piketty and Saez (2003), and Kaymak and Poschke (2016).
Decomposing the Increase in the Top 1% Wealth Share
The main results are shown in Figure 5. The white line shows the path of the top 1% wealth share in the model. It tracks the evolution of the data closely, in particular since 1980, indicating that the model does a good job at reproducing the overall evolution of wealth concentration (the model performs less well in the 1970s, a decade in which large fortunes where affected by a series of shocks that are not captured by the model).
Figure 5. Decomposition of drivers of the top 1% wealth share
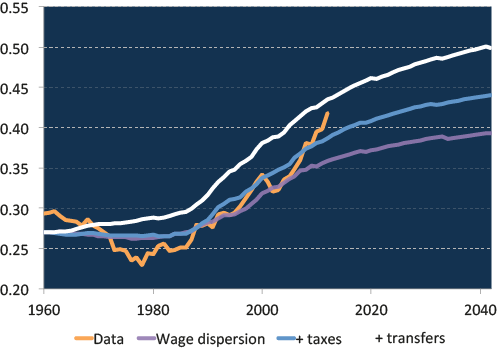
Given this success, we next use the model to make predictions for counterfactual scenarios, shown in the other lines in the figure. To gauge the importance of the three potential drivers of wealth concentration discussed above, we simulate two scenarios. The first one only features increasing wage dispersion, in line with the increase in earnings dispersion observed in the data, and abstracts from changes in taxes and transfers. The second one additionally incorporates lower top income taxes and lower corporate and estate taxes, as observed in the data.
The purple line shows the top 1% wealth share for the first counterfactual scenario. It is clear from the figure that technological factors play a dominant role not only for changes in income inequality, as is well known, but also for wealth inequality. As high-earning households save part of their additional income, their share of wealth also rises. This channel accounts for about half of the total increase in wealth inequality.
Tax cuts and the expansion of transfers each account for about half of the remainder (the gap between the purple and blue lines shows the effect of tax cuts, while that between the blue and white lines shows that of increased transfers). While tax cuts encourage saving, larger transfers reduce saving incentives for retirement, in particular for low and middle income groups. This implies that these groups’ share of private wealth declines. Note though that this is partly due to the fact that measures of private wealth inequality, like those compiled by Saez and Zucman, do not include claims to future government transfers, like social security, which constitute wealth for their owners.
Studying the paths of income and consumption inequality in a similar way leads to two notable results. First, the top pre-tax income shares barely respond to tax changes. This is because lower taxes drive up savings and, hence, reduce the rate of return on capital, counteracting the effect of tax cuts on top incomes (lower interest rates have recently been an important topic of discussion among economists; see e.g. the VoxEU pieces by Sir Charles Bean 2015 and John Williams 2015). Second, higher government transfers have counteracted the increase in consumption inequality due to lower taxes on top earners. As a result, consumption inequality rises less than after-tax income inequality.
Even Higher Wealth Inequality in the Future
In his book, Piketty makes an attempt to forecast the evolution of wealth inequality. Our analysis also allows us to do so. Since wealth concentration reacts fairly slowly to changes in the economic environment, we find that the effect of more recent changes in fiscal policy and wage dispersion has not yet materialised fully. As a result, our model predicts two more decades of rising wealth concentration, at the end of which the wealthiest 1% will eventually hold approximately half of the total private wealth in the US.
Concluding Remarks
Our analysis attributes most of the increase in wealth inequality to the rise in wage dispersion. Since the latter is often attributed to skill biased technical change, a substantial part of the increase in wealth inequality is likely to persist even if tax policy were to return to 1960s levels. The results also highlight the role of transfer policies in explaining wealth dispersion, a factor often neglected in discussion of policy-based explanations for income and wealth inequality. Put differently, statistics on wealth inequality that do not capture households’ claims on the public sector are incomplete and overstate top wealth shares. This calls for future research documenting the distribution of claims on the public sector to help put studies on wealth and income inequality in perspective.
References
Bean, C (2015), “Causes and consequences of persistently low interest rates”, VoxEU, 23 October.
Castañeda, A, J Díaz-Gimenez and J-V Ríos-Rull (2003), “Accounting for the U.S. earnings and wealth inequality”, Journal of Political Economy 111 (4): 818–857.
De Nardi, M, G Fella and F Yang (2015), “Piketty’s book and macro models of wealth inequality”, VoxEU, 22 December.
Joulfaian, D (2013), “The Federal Estate Tax: History, Law and Economics”, US Department of Treasury, Office of Tax Analysis.
Kanbur, R and J Stiglitz (2015), “Wealth and income distribution: New theories needed for a new era”, VoxEU, 18 August.
Kaymak, B and M Poschke (2016), “The evolution of wealth inequality over half a century: The role of taxes, transfers and technology”, Journal of Monetary Economics 77:1-25.
Piketty, T (2014), Capital in the Twenty-First Century, Harvard University Press.
Piketty, T and E Saez (2003), “Income inequality in the United States”, Quarterly Journal of Economics 118 (1): 1–39.
Piketty, T and E Saez (2007), “How progressive is the U.S. federal tax system? A historical and international perspective”, Journal of Economic Perspectives 21 (1):3–24.
Piketty, T, E Saez, and S Stantcheva (2014), “Optimal Taxation of Top Incomes: A Tale of Three Elasticities”, American Economic Journal: Economic Policy 6(1):230-271.
Saez, E, and G Zucman (2014), “Wealth inequality in the United States since 1913: Evidence from capitalized income tax data”, NBER Working Paper 20625.
Williams, J C (2015), “Will interest rates be permanently lower?”, VoxEU, 26 November.
Endnotes
1 The model is a variant of the ‘standard incomplete markets’ model and builds on work by Bewley et al. and on more recent work by Castañeda et al. (2003).
2 The latter is consistent with a strong role for rising wage dispersion in explaining patterns of inequality. If corporate and estate tax cuts were the dominant factor, we would instead have seen a rising share of capital in top incomes.
3 Although r>g in the model, the top 1% share converges to a finite level. The reason is that even if very wealthy households also have high saving rates, they still consume some amount. This bounds their wealth accumulation.


Epic fail. What was the ratio of CEO and top Exec salaries to line workers in 1960? In 2010? How do stock options create wealth? What percentage of income in 1960 went to food and housing? In 2010? How many people were bankrupted by medical bills in 1960? In 2010? How had the Great Depression and 25 years of extractive taxes affected the wealthy families in the era pre-1930 when wealth accumulation was similar to today?
Again, I am forced to assume these men are idiots or liars.
Again, I am forced to assume these men are idiots or liars.
It’s actually much worse than that: they’re economists.
Worse than that.
They’re otherwise intelligent liars, working for powerful idiots.
That’s my new definition of economists.
I think more that they are otherwise intelligent idiots, working for powerful liars.
This because they can construct quite the massive mathematical models to fit their theories, but their theories are more theology than science.
Food housing and clothing represented around 65-70% of income in 1960-1961. That would explain the size of the closets in the homes built in those days. This is vs. 50% in 2002-2003.
According to bls 100 years in consumer spending: http://www.bls.gov/opub/uscs/home.htm
I’d be curious to see this broken down by quartile of income. I’m not sure the mean tells you much.
In my experience, closets (cupboards) in 1960s houses are about twice the size of affluent family closets in the 1800s
Closets (cupboards) in 1920’s houses are about the same as affluent families in the 1800s.
What is my experience? I’ve lived in over 30 houses in my life, ranging from built in the early 1800s (The Old Rectory, UK), to modern (Huntington Beach, CA, built in 1996).
From what I have seen, house built before the 60s typically did not have many closets for clothes because armoires were used.
“Our analysis attributes most of the increase in wealth inequality to the rise in wage dispersion. Since the latter is often attributed to skill biased technical change, a substantial part of the increase in wealth inequality is likely to persist even if tax policy were to return to 1960s levels.”
Come on, guys. Really? “… often attributed to skill biased technical change”. How about globalization, outsourcing, destruction of unions, growth in the precariat population, gig economy, shrinking gov’t to what can be drowned in a bathtub … etc etc
And, one more question for the authors: Could you please let us know the respective ratios of, on the one hand, total wealth dollars per wealthy person versus total gov’t transfers per person? The data show total transfers have risen… but, given the 1% vs 99% plus population growth, how has the ratio change since 1960?
Since the subject is inequality, per capita for at least the tranches mentioned would be useful. And although the chart shows that “government transfers since 1960, mostly due to the expansion of public pensions (social security) and the introduction of public health insurance for the elderly (Medicare). Combined spending on these two programs accounted for almost 9% of US GDP in 2010, up from less than 3% in 1960 (see Figure 3),” it also shows that SS was relatively stable since the ’80’s, it is Medicare that hikes the rates. And I suggest that Medicare can be understood as to the Medical industry, not individuals.
How about lack of anti-trust enforcement? “Technology” is actually often = to “network effects”. You see that not only with things like Google and Microsoft’s lousy but ubiquitous Office products, but also in capital markets services (trading markets over time favor traders who can obtain a dominant position and get information advantages). We used to break them up or seriously curb their behavior. No more.
Large investments in the 50s and 60s, permitted Americans and Canadians to go from investment in the commons to the cult of individualism gradually eroding infra and social structures. The irony is that most of the top 10-20% do not see this… While driving their children (buses used to do this) to dilapidated 1950-1960s schools on pot-holed streets in their luxury cars, they are thoroughly disgusted with government and want their taxes to go even lower thinking private businesses will take care of it…
While the top 10-20%, have gotten richer, their lifestyles have also ballooned, meaning they will need even more money to sustain it during their possibly 30 years of retirement. So they have been reinforcing all the policies that have given them this lifestyle. And the top 10-20% are the lackeys of the 1%.
They have an ideology that tells them what they are doing is just and right. No one wants to believe they are a bad person. But your 10-20% “Lackeys” of the 1% are a shrinking class because of tech and foreign competition – no revolution can happen unless the bourgoisie is on board and the oligarchs are blithely beggaring the very people who will lead the head-cutting-off brigades.
And they will only come on board when they start seeing their benefits get cut… pension plans are next in line… I wonder what percentage of NC readership is in this 10-20%.
Housing, food and clothing used to eat up close to 70% of income in the early 60s. Today, it’s around 50%. If it slowly goes back to 70%, this means a lot of companies depending on discretionary spending will shrink… this means CEOs in these sectors will start losing clout vs. non-discretionary and energy sectors… maybe then we will start to see the elite fight a little more for some lament of fairness.
10-20% “Lackeys” of the 1% are a shrinking class because of tech and foreign competition – no revolution can happen unless the bourgoisie is on board and the oligarchs are blithely beggaring the very people who will lead the head-cutting-off brigades. True enough. But don’t forget the role of the enforcers who are the police and military arm of the 1%. While the 1% expansively encouraged the unwashed lumpen to amass small arsenals of weaponry for their own corporate profit and to provide a false security blanket, the 1% is making damned sure the enforcers have military grade tools to easily mow down any resistance. If you lose the enforcers you got bupkis. Just ask Nicholas II who went from mighty military ruler of a huge nation to a non-entity in a funny looking Gilbert and Sullivan uniform in a matter of days after the police refused to fire on protesters and the defiance spread rapidly through out the imperial army as soldiers also threw down their arms. When I see police pepper spraying protesters I wonder at their anger at the protesters who are also protesting for a better life for the children of policemen as well. The key is to unite enforcers, minorities, poor and other exploited groups. The 1% understand this which is why they keep the various factions sniping at each other instead of uniting against the real foe. Since the early days of American colonies when African slaves would unite and rebel with indentured servants, the colonial 1% divided them by throwing race into the mix.
@Doug @ JAmes – this is an economic modeling exercise – it attempts to explain “the rich getting richer” (and how! – +50% in wealth share in 40 years is extraordinary) in public policy terms. And the results are interesting and useful, IMHO. For example – why do you think the oligarchs’ propaganda machine so consistently trumpeted “no death tax” and other attacks on the estate tax in the early 2000’s? CLearly the weakening of the estate tax contributed greatly to the increase in wealth concentration.
Now – “globalization” – how on earth do you even define this, let alone model its economic effects? As the authors note, technological changes increase wealth concentration – but to what extent is globalization the result of technology? What are the other factors? IMHO cultural and ideological factors are a huge contribution – when your ideology tells you that efficiency and profitability are the highest goals, and you are doing people a favor by shifting their employment to more efficient areas, and you are entitled to a share of the extra profits gained, you get an apparently traitorous ruling class that not only feels no obligation to the rest of society, but feels that this is the just and right order. POlicy changes are the outcome of this process – the estate tax, for example, could never have been weakened to such an extent if not for generalized neo-liberal ideology trumpeted by the oligarchic propaganda apparatus. The corollary is the general decline in public morality in favor of neo-liberal “efficiency” – when the social contract is dishonored so drastically, the breakers are putting themselves in a dangerous place – they have bodies and they are few and if the many have nothing to lose, watch out!
When your standard of living increases drastically, public pensions peanuts compared to its costs and you think you will live 30 years without working, it’s amazing the prayers and sacrifices you will make to get the market gods on your side.
Putting in my own economically uneducated $0.02 here, but I agree, it is a useful model. I just happen to thing that their explanation for wealth disparity, “wage dispersion” and “expansion of transfers” are foolish. They also do not discuss at length this statement, “As high-earning households save part of their additional income, their share of wealth also rises. This channel accounts for about half of the total increase in wealth inequality.”
In other words, their neutrality in describing their model is maddening and though it may be a useful “economic model”, that’s all it is, an exercise in economic modeling, and their conclusion on taxes is meaningless.
Wage dispersion – CEO level wages are now, at least, 200 to 300 times the average overall wages of average companies.They were around 50 to 60 times larger in 1960. Technology has nothing to do with this.
Expansion of transfers – Companies like Walmart intentionally have a very wide “wage dispersion” knowing that “expansion of transfers” will subsidize their lower end majority of wage earners. This results from the so-called 1% driving the national economic policies.
Also to my way of thinking, the “savings accounting for 1/2 the increase” seems accurate. The issue to me is that obviously these aren’t savings in the sense of Bank Savings Accts. (who gets wealthy on 0.67% interest?) but investments in assets, primarily housing, land, and equities, that have been intentionally inflated to a level that most cannot afford due to their low end government subsidized (“expansion of transfers”) wages.
Modeling is all well and good, but modeling in the social science of economics, in it’s attempt in trying to come across as neutral and efficient in the style of a math or physics model, is extremely detrimental since it leaves itself opened to a wide variety of useless political solutions.
We all know who controls those “solutions”.
Modelling is simply economists trying to justify their inane prognostications. The Fed blew asset bubbles across all economic segments. The only holders of significant assets are the 1%. That’s all you need to know about wealth inequality.
I thought this article was vacuous too. So I read the Kanbur & Stiglitz offering above, Wealth and Income Distribution… and it saved me. Very clear arguments sounding much like Michael Hudson and arguing for progressive taxation and both redistribution of wealth and of opportunity for the poor because it is clear that, even without concerns about offshoring and trickle downing, inequality starts in the womb and ends in the coffin. Stiglitz and Kanbur do not trash international trade but it is clear that national inequality produces international inequality because as they point out K (capital) becomes W (wealth) in an upward spiral that self perpetuates but for Labor there is no upward spiral because of (essentially) the policies of laissez faire capitalism. The eternal squabble between equality and liberty lives. And only active political economix can correct the inequalities.
This one is hard to believe: “These government programmes (Social Security and Medicare) tend to curb the need to rely on personal savings for retirement, especially among low and middle-income households, and might thus explain why their share in total wealth has declined.”
Get it? If the government gives money to the sick and aged, this reduces their share of total wealth. The solution, obviously, is to cut Social Security and Medicare.
Gimme a break. Was this written by the Koch brothers?
What Rodger said.
This “study” would have us ignore the fact the Nordic countries have much more generous health care and pensions, yet less inequality.
This “study” would have us ignore the fact that burger flippers in Denmark get paid as much as skilled workers in America.
I’ve never known any poor person who saved less money because they could count on an $800 SS check when they retired. The truth is that poor people don’t save for the simple reason that they’re struggling to merely survive. Saving is something that wealthy people do.
I’m surprised that NC posted this garbage.
I’ve noted, on more than one occasion, that neoliberal drivel such as this is posted up at NC as a sort of piñata– for us in the peanut gallery to enjoy taking whacks at. The comment candy that falls out is often surprisingly interesting and valuable.
The idea, that poor and working people are deliberately choosing not to accumulate wealth, because of the over-generosity of S.S. and Medicare is, of course, risible in the extreme!
Exactly.
Oooh! That’s an agent provocateur at work. I know the type. That’s why I send money.
yes, and pretty sure this one is going to fill my sunday with entertaining insights. Also it’s good to be shown what passes for serious thinking. This past week I spent some time trying to convey to a wealthy person how a wealthy person has more motivation to work in order to retain savings, while there’s no reason to be motivated when you have no savings and your pay won’t cover your bills. This article seems like ammunition for the class war, and a pre-emptive strike at tax increases, unless of course those increases are on medicare or SS.
That’s why I only read the comments. But really, shouldn’t we give the guys a break.
Their just making a paycheck. Like they say,anything for a buck.
What Roger and Dan said.
It would be interesting to compile a catalogue of the benefits people still receive for their taxes in countries like Denmark. Last week I talked with a Ph.D chemistry student in Arizona for a friend’s wedding. I know he said students receive an $800 a month payment (salary?) for up to 72 months while they are pursuing their studies. And I believe he said tuition was basically free. (Make the Sanders education plan look like a piker, no?)
Foreign readers please chime in. It is unlikely we will be reading this in the main stream media of the Land of the Free.
In the US, PhD students in engineering usually receive full tuition + fees and a monthly stipend. The advice given to PhD students in engineering is to not pursue a PhD unless given such an offer for support. The yearly stipend comes to around 30-40k per year. Some of the STEM fields in the US are similar, like in biology and chemistry.
The student in question was definitely after a PhD. But I assumed the $800 monthly stipend and free tuition was available for ALL higher education students (“for up to 72 months”), not just PhDs. Anyone know if this is the case in Denmark and / or elsewhere?
Grad students are generally provided with a combination of employment (research assistanceships, TA-ing), grants and fellowships, and loans. One in my family is currently surviving as a PHD candidate without using his available loan, but he is 3rd world frugal.
NC just wants to be sure that you know that you should go long in guillotine futures!
Is the model a computer simulation? I’m not sure what exactly was proved here. Economics — for all its mathematical formulas — still seems like a branch of moral philosophy prescribing what we should do, not a predictive quantitative science telling us the way things are. This study did nothing to dissuade me from that assumption. It does successfully evade real social issues by basing its conclusions on a simulated model of quantifiable social factors that the authors admit doesn’t work so well in all time periods.
I love how everyone is pointing out the almost comedic fails in this approach. I feel like if we were crafting an NC parody of establishment economics, this is about what we would produce.
But I do take it as very good news in the big picture. Inequality as our driving social problem is out of the bag. It will not leave the public consciousness until we act meaningfully to address the situation – no matter how much the intellectual class prattles on about technological changes and skills and implies social insurance aggravates concentration of wealth and power.
I said it somewhere else today.
It’s become more and more clear that economists are leveraging their understanding of calculus to invent excuses for demented psychopaths whose only interest is in having it all.
One of the Koch brothers is quoted as believing his fair share is “all of it“.
Two things become obvious if we take him at his word;
1. If he succeeds in having it all, the result is we have nothing.
2. Calculus is unnecessary to model naked, psychopathic greed, and so, economists and their models are obviously important for some other reason, which IMHO is creating the smoke-screen behind which those demented psychopaths work towards their clearly stated goal.
It’s the deified, reified notion that markets are somehow more than people making choices that gets me every time. “The Market” doesn’t pay people. CEO’s and other top execs get paid by Boards of Directors who set their compensation. “Markets” are a smoke screen for real-world identifiable actors. These guys are getting their class buddies on the Boards to fork over huge amounts of money to a tiny fraction of the population. “Markets” have nothing to do with it. The Board of Exxon could say “you’re getting $500,000 plus medical, dental, and clothing, food, and transport stipends–take it or leave it, because there and hundreds of men and women out their who will take it a nanosecond after we present the offer.”
But that would make sense.
And what about all the rich folks kids?
if the system is built to push ever higher asset prices it will cause asset owners to become richer at the expense of others. without them doing a thing. this is a corollary of the paper money system. by itslef it has no value. it drevies it from the value of the collateral. so the system has to inflate collateral till infinity.
i dont know why this is so hard to understand.
When I hear hacks talking about “skill based technological change” I release the safety catch on my Browning.
I think it was Krugman of all people who looked at this question, and concluded that it was government policies, mainly federal government policies, which were causing the increase in wealth inequality. If I remember correctly, it wasn’t even close. This came out about a decade ago.
Gee…I guess I was wrong that non-prosecuted, white collar criminal activity had any effect…
A competing explanation emphasises changes in the economic environment, particularly in production technologies, that favoured skilled workers and widened the wage distribution.
Total gibberish. Those were the jawbs that were outsourced to China.
An example of wealth transfer happening now, is Bombardier getting a $1billion subsidy from the Canadian government, and simultaneously sending work to China and Mexico. The little people of Canada get stuck with the bill for further enriching the Bombardier family, and have the pleasure of seeing their jawbs outsourced by that same family.
That’s modern day capitalism as practiced by the Canadian elite.
Hey, haters, what is your problem? Are you really going to attack these guys because they point out a fact about methodology (expected future transfer payments aren’t captured in wealth stats)? Or maybe you’re all pissed off that they point out that tax policy isn’t enough…? It’s baffling.
And, lest we forget, technological change has been a large part driving wage dispersion, as we often discuss here (e.g. robots, out-sourcing, mechanization of jobs a la Amazon). These guys point that out and get eviscerated in the comments because of the way they phrased it. You take exception to the concept of “skill biased technological change” and therefore write off the entire article?!? Come on, people…
How about this: non-tax changes in the economic system have been major drivers behind increasing income and wealth disparities. A return to 1960 tax-levels, therefore, will be insufficient to redress these disparities. Other changes to the economic system, such as {insert pet policy prescription here} will also be necessary.
Their bizarre notion about why the po’ folks don’t save set people off. They offered up this gratuitous, non-supported, “out-of-right-field” idea without any reference to pertinent data. Their modeling effort didn’t bear any relationship to such a conclusion; it appeared like a magic talisman in their prose, shining up out of nowhere, preceded by nothing.
I can’t believe this kind of ‘research’ makes it through peer review. Even in economics. Conclusions are supposed to be at least minimally supported by Results in academic articles.
if it weren’t for ss and medicare, the poor folks would get a 4th job so they could save more! takers!
We, the pharmaceutical industry, are working on the 4th job problem. We believe some drugs will eliminate the need for sleep, and the drugs will only cost about 85% of the net gain for the worker.
There are a few minor side effects, but these will increase savings due to reductions in life expectancy.
Diptherio’s final paragraph makes sense. There are many causes of the expansion of inequality, and correcting the tax system will not, by itself, fix the problem.
But Fluffy has a very good point, too, and others have commented on it as well: the authors appear to be blaming Social Security and Medicare for the difficulty in saving money that lower and middle income people have. The authors ignore the fact that all upper income Americans above age 65 are also eligible for Medicare, and the great majority of them are also eligible for Social Security. Yet those people have no difficulty saving plenty of money for retirement, second or third homes, luxury cars, first class air travel, $2700 donations to politicians, etc. The authors also neglect the obvious point that Social Security payments aren’t enough to avoid poverty. Even with the expectation of Social Security and Medicare, everyone should save money for retirement, but many are unable to do so.
There are a lot of problems with this article, although the authors do manage to make a few useful points.
The fact is that its impossible to meaningfully evaluate the article’s merits because, like a lot of economics research, it’s based on a “black box” model that we as readers aren’t allowed to peer into. Without knowing how the model was constructed, including the assumptions it embodies and the data that was fed into it, we have no way of assessing the quality of the model’s outputs. Basically what the authors are saying is “just trust us”. For my take on that, please refer to my reply to James Levy above.
Aside from that the authors’ ideological slant is obvious. Future transfer payments aren’t captured in wealth stats? Why would they be? Future anticipated income isn’t current wealth. I don’t count my potential earnings 10 years from now as wealth, and I doubt you do either. Also, it’s impossible to evaluate the size of these transfers in advance – for example if you died before reaching 65 the value of these transfers will in most cases be zero. Even if you live to be 65 by then there’s an excellent chance the bipartisan consensus in Washington in favour of cutting social security will have born fruit and your actual income will be substantially lower than the current estimate. For these and other reasons it makes much more sense to count transfers as income at the time they are received.
Then there are gems like this: “These government programmes tend to curb the need to rely on personal savings for retirement, especially among low and middle-income households, and might thus explain why their share in total wealth has declined.” Basically what the authors are suggesting -without any empirical evidence mind- is that prior to 1960 low and middle income earners saved more rather than spending on consumption and therefore accumulated more wealth. The very idea that prior to 1960 low income earners could accumulate substantial savings is highly suggestive of the degree of historical illiteracy we’re dealing with here (unfortunately typical of the discipline). Having said that, it seems to me that there is a simple and direct method for evaluating this hypothesis: just look at historical data on retiree savings and see if the data shows retirees had substantially more savings prior to 1960. That kind of unglamorous intellectual spadework doesn’t appeal to many economists however, who are the real intellectual heirs to continental idealist philosophy. So much more elegant and impressive to construct a model to attempt capture this data. The model’s outputs might be total garbage, but hey, it’s pretty to look at and gives us street cred with our peers, which is what builds careers.
Followed by this: “Our analysis attributes most of the increase in wealth inequality to the rise in wage dispersion. Since the latter is often attributed to skill biased technical change, a substantial part of the increase in wealth inequality is likely to persist even if tax policy were to return to 1960s levels.” Note the weasel words. Turns out the key part of their argument actually rests on nothing more substantial than the conventional wisdom that prevails in the discipline, which in turn is based largely on professional, ideological and class bias.
i take issue with your jab at continental idealism… i think they (economists) are the inheritors of rationalism. (as opposed to empiricism) i dont know anyone who has an interest in continental philosophy and accepts the idea of free markets… seriously not one
My comment was in no way meant to slander idealist philosophy, my only point is that economics shares with it a normative preference for a priori abstraction (usually mathematically expressed, in the case of economics) unmoored to any genuine commitment to robust empiricism.
In any case if this is the strongest objection that is raised against my critique then I’ll take it as a backhanded compliment!
@ Dan Lynch: “Saving is something that wealthy people do.”
Right on, dood!
None of these economic idiots has ever had to live in the real world. Between housing (35%-50% of after-tax income), transportation (5%-10% of after-tax income), food (10%-15% of after-tax income), property taxes, health “insurance,” auto insurance, homeowners/renters insurance (aggregated, 15%-20% of after-tax income), gas/electricity/phone/internet (5%-10% of after-tax income), believe me, there is little to nothing left for “savings.” I defy anyone to take one of these listed items and characterize them as less than “necessities” in today’s capitalist nightmare that is the U S of A.
Do the math. Sheesh.
RE inflation, assets in a bad bank, is neither money nor wealth. Prices have nothing to do with supply and demand and everything to do with feudal RE control, the only possible outcome of which is falling living standards and increasing income inequality, for which the majority volunteered, making America and Canada dumping grounds for the money laundry industry. Yes, you are responsible for accepting and using free money, for every political group demanding a piece of the pie they didn’t make.
Work should lift people out of poverty, not more of the political hack jobs that created the poverty.
Hiring hacks to decide who will have children and how those children will be educated to vote, to breed stupid, and then complain about the banks printing money for the operation, for taking too big a cut, is a tad disingenuous. A first year stem student can see that, hence peer certification.
Luckily I have no background in economics and so I haven’t been indoctrinated with lots of bad ideas.
I have a background in electronic and silicon chip design, so I am quite good at complex problem solving.
Looking into 2008, I had to dig all the way down to the very nature of money itself to find the problem.
The problem was right at the bottom; the very nature of money itself is well hidden and hardly understood by anyone.
Do the same for Capitalism and it’s all there, it is what it is and it drives inequality unless large amounts of external redistribution are applied …..
Most of today’s problems can be clearly seen by understanding the true nature of Capitalism.
Once this is understood it easy to see why redistribution is necessary.
A failure to recognise the true nature of Capitalism has led to the slump in demand through ever rising inequality.
The true nature of Capitalism has obviously been forgotten over time.
Today we think it brings prosperity to all, but that was certainly never the intention.
Today’s raw Capitalism is showing its true nature with ever rising inequality.
Capitalism is essentially the same as every other social system since the dawn of civilisation.
The lower and middle classes do all the work and the upper, leisure Class, live in the lap of luxury. The lower class does the manual work; the middle class does the administrative and managerial work and the upper, leisure, class live a life of luxury and leisure.
The nature of the Leisure Class, to which the benefits of every system accrue, was studied over 100 years ago.
“The Theory of the Leisure Class: An Economic Study of Institutions”, by Thorstein Veblen.
(The Wikipedia entry gives a good insight. It was written a long time ago but much of it is as true today as it was then. This is the source of the term conspicuous consumption.)
We still have our leisure class in the UK, the Aristocracy, and they have been doing very little for centuries.
The UK’s aristocracy has seen social systems come and go, but they all provide a life of luxury and leisure and with someone else doing all the work.
Feudalism – exploit the masses through land ownership
Capitalism – exploit the masses through wealth (Capital)
Today this is done through the parasitic, rentier trickle up of Capitalism:
a) Those with excess capital invest it and collect interest and rent.
b) Those with insufficient capital borrow money and pay interest and rent.
All this was much easier to see in Capitalism’s earlier days.
Malthus and Ricardo never saw those at the bottom rising out of a bare subsistence living.
This was the way it had always been and always would be, the benefits of the system only accrue to those at the top.
It was very obvious to Adam Smith:
“The Labour and time of the poor is in civilised countries sacrificed to the maintaining of the rich in ease and luxury. The Landlord is maintained in idleness and luxury by the labour of his tenants. The moneyed man is supported by his extractions from the industrious merchant and the needy who are obliged to support him in ease by a return for the use of his money. But every savage has the full fruits of his own labours; there are no landlords, no usurers and no tax gatherers.”
Like most classical economists he differentiated between “earned” and “unearned” income and noted how the wealthy maintained themselves in idleness and luxury via “unearned”, rentier income from their land and capital.
We can no longer see the difference between the productive side of the economy and the unproductive, parasitic, rentier side. This is probably why inequality is rising so fast, the mechanisms by which the system looks after those at the top are now hidden from us.
In the 19th Century things were still very obvious.
1) Those at the top were very wealthy
2) Those lower down lived in grinding poverty, paid just enough to keep them alive to work with as little time off as possible.
3) Slavery
4) Child Labour
Immense wealth at the top with nothing trickling down, just like today.
This is what Capitalism maximized for profit looks like.
Labour costs are reduced to the absolute minimum to maximise profit.
The beginnings of regulation to deal with the wealthy UK businessman seeking to maximise profit, the abolition of slavery and child labour.
The function of the system is still laid bare.
The lower class does the manual work; the middle class does the administrative and managerial work and the upper, leisure, class live a life of luxury and leisure.
The majority only got a larger slice of the pie through organised Labour movements.
By the 1920s, mass production techniques had improved to such an extent that relatively wealthy consumers were required to purchase all the output the system could produce and extensive advertising was required to manufacture demand for the chronic over-supply the Capitalist system could produce.
They knew that if wealth concentrated too much there would not be enough demand.
Of course the Capitalists could never find it in themselves to raise wages and it took the New Deal and Keynesian thinking to usher in the consumer society. They can never let a penny go and would only issue credit to keep consumption going in the short term.
In the 1950s, when Capitalism had healthy competition, it was essential that the Capitalist system could demonstrate that it was better than the competition.
The US was able to demonstrate the superior lifestyle it offered to its average citizens.
Now the competition has gone, the US middle class is being wiped out.
The US is going third world, with just rich and poor and no middle class.
Raw Capitalism can only return Capitalism to its true state where there is little demand and those at the bottom live a life of bare subsistence.
Capitalism is a very old system designed to maintain an upper, Leisure, class. The mechanisms by which parasitic, rentier, “unearned”, income are obtained need to kept to an absolute minimum by whatever means necessary (legislation, taxation, etc ..)
Michael Hudson’s book “Killing the Host” illustrates these problems very well.
When you realise the true nature of Capitalism, you know why some kind of redistribution is necessary and strong progressive taxation is the only way a consumer society can ever be kept functioning. The Capitalists never seem to recognise that employees are the consumers that buy their products and services and are very reluctant to raise wages to keep the whole system going.
We don’t need to keep speculating, the answers all lie in the past.
Understand the Capitalist system and all is revealed.
It is what it is.
Know what it is and how it works (part 2 – money)
Banks create money out of nothing to allow you to buy things with loans and mortgages (fractional reserve banking).
After years of lobbying the reserve required is often as good as nothing. Mortgages can be obtained with the reserve contained in the fee.
After the financial crisis there were found to be £1.25 in reserves for every £100 issued on credit in the UK.
Having no reserve shouldn’t be a problem with prudent lending.
Creating money out of nothing is the service they really provide to let you spend your own future income now.
They charge interest to cover their costs, for the risk involved and the service they provide.
Your repayments in the future, pay back the money they created out of nothing.
The asset bought covers them if you default, they will repossess it and sell it to recover the rest of the debt unpaid.
At the end all is back to square one.
The bank has received the interest for its service.
You have paid for the asset you have bought plus the interest to the bank for its service of letting you use your own money from the future.
Today’s massive debt load is all money borrowed from the future for things already bought.
It can also go wrong another way, when banks lend into asset bubbles that collapse very quickly. The repossessed asset doesn’t cover the outstanding debt and money gets destroyed on the banks balance sheets.
When banks lend in large amounts, on margin, into stock markets, the bust shreds their balance sheets (1929).
When banks lend in large amounts on mortgages into housing markets, the bust shreds their balance sheets (2008).
If banks don’t lend prudently you are in trouble.
They developed securitisation where they could bundle up loans and sell them off meaning they no longer had to lend prudently.
They had leveraged up the US mortgage market with complex financial instruments.
It boosted profits on the way up and losses on the way down.
From the world of engineering you understand under-damped, over-damped and critically damped systems.
Under-damped – reacts quickly, but is inherently unstable.
Over-damped – reacts slowly.
Critically damped – the perfect setting that reacts as fast as possible without being unstable.
The world of finance looks like an under damped system that is unstable.
The totally free movement of Capital around the world makes for an unstable system.
It is good for the 62 people who own as much as the bottom half of the world’s population to maximise their return.
It is bad for nations and the millions of people who live within them as the few maximise their returns with an inherently unstable system.
Critical damping is usually reached with negative feedback to slow the response time to a value that is stable.
There are two types of feedback:
Positive feedback – adds to the initial input increasing it.
Negative feedback – subtracts from the initial input decreasing it.
Positive feedback tends to make systems unstable.
Negative feedback tends to make systems stable.
What we see in large asset bubbles, e.g. housing, is positive feedback due to the nature of money.
It makes the boom bigger on the upside and the bust bigger on the down side.
The money creation process creates all the money up front for the loan/mortgage and the repayments are made slowly over a long period of time.
In the case of the housing market the repayment process is very slow indeed, 25 years or so.
The money comes into the system very quickly and is taken out of the system very slowly.
There is a long sting in the tail from any asset price boom blown by debt, even if you don’t get the big bust with defaults, repossessions and money destruction on bank balance sheets.
The money creation involved in a housing boom feeds out into the general economy creating a wider feel good factor. It feels good as money seems to be plentiful which is actually the case.
If you get the big bust where prices fall rapidly, normally caused by rising interest rates making once affordable mortgages, unaffordable for people on variable rates. Then you get money destruction on bank balance sheets as the repossessions can’t be sold to cover the outstanding debt. The money destruction feeds out into the general economy creating a wider feel bad factor.
It feels bad as money seems to be in short supply which is actually the case.
With housing and other asset price bubbles around the world, the Central Banks are trying to put off the day of reckoning with ultra low interest rates.
With all the debt in the world there is a constant drain from the repayments outstanding so it is impossible for the economy to recover. Re-structuring the debt just pushes the repayment problems out further in to the future.
We had the good times when all that money was created and spent, now we have the long sting in the tail of repayments.
The fear of the big crash and massive money destruction makes the current situation the least, worst option. As we can see from Japan though, it is a situation that is very hard to escape from.
Better to understand money and not let these problems build in the first place.
Let’s find someone that does take debt and the true nature of money into account in their models.
In 2005, Steve Keen, saw the crisis coming and the private debt bubble inflating.
In 2007, Ben Bernanke, could see no problems ahead.
It’s all a bit late now.
What we need is a solution to the debt overhang and not throwing money at banks to create more debt.
Debt is the problem and does not form any part of the solution.
Debt re-structuring is just pushing the problem further into the future.
“The totally free movement of Capital around the world makes for an unstable system.” Amen
If the world worked as they assumed in their model, then results are what we have seen. That is no proof that the world actually does work the way their model assumes. The real world could actually work in completely different ways and produce the same results we have seen.
What they don’t seem to account for in the way the world works is that the high tax rates of the past prevented corporations from making their top execs extremely wealthy by paying them high salaries. It just got taxed away if they tried it. As a result, more corporate money was reinvested in the corporation. In order for this reinvested money to be useful, the corporations needed more customers to buy the stuff the reinvestments could produce.
Now that key executives can become quite wealthy just from salaries and stock options, it is much more effective in making them rich to just give the money to the executives rather than investing it in the companies. This scheme does not require increasing production, investing in workers, paying them fairly, nor keeping them healthy, nor keeping them solvent in retirement. If this feedback effect is not in their model, then how are they going to measure its impact on what their model predicts for the future.
The trouble with models is that you can only put in them what you are capable of imagining. You will never measure the results of real world things that you weren’t capable of imagining. In my forty years of modeling integrated circuits, we always found new technology introduced new behaviors that we had not previously seen nor imagined. Close synchronization of the models with real world measurements is what kept the idea of modeling and simulating as an indispensable part of designing and building integrated circuits.
The inequality also comes from the corporate tax as a percentage of total tax revenue.
In the 60’s, corporate tax comprised 20% of federal tax revenues while today it is less than 10%, forcing the working class to pay more taxes.
After four decades of supply side economics all the money has concentrated at the top.
62 people now own as much as the bottom half of the world’s population.
There are few investment opportunities as demand is so subdued.
US companies engage in share buybacks as there is no point in expanding and investing due to the lack of demand.
The newly impoverished consumer needs some money to spend and is not going to get it through his meagre pay packet.
Helicopter money must be fed in at the bottom where it can be spent into the economy.
Pretty soon it will have trickled up to be stashed in tax havens.
There is something to be said for redistribution through taxation, but I suppose we can do it this way.
The top 1% have access to financing that the average person does not, hence they are able to accumulate assets, these assets are then held offshore and in a further twist to the average person, their taxes and liabilities are minimal.
Adam Smith is held in high esteem but no one seems to be familiar with his work.
Adam Smith:
“The Labour and time of the poor is in civilised countries sacrificed to the maintaining of the rich in ease and luxury. The Landlord is maintained in idleness and luxury by the labour of his tenants. The moneyed man is supported by his extractions from the industrious merchant and the needy who are obliged to support him in ease by a return for the use of his money. But every savage has the full fruits of his own labours; there are no landlords, no usurers and no tax gatherers.”
Here he sees those at the top as being idle and not those at the bottom as widely believed today.
Here he is highlighting the trickle up of Capitalism through “unearned” income, rent and interest.
Those with excess capital collect rent and interest.
Those with insufficient capital pay rent and interest.
Where today’s ideas of trickledown come from I have no idea, probably the wishful thinking of US billionaires looking for lower taxes. Anyway, it’s totally wrong and the system trickles up through “unearned” income which was known by nearly all the Classical economists.
Assuming money flows in the opposite direction to reality can only drive inequality.
Capitalism has a built in benefits system to maintain the wealthy in luxury and leisure, “unearned” income.
Well spotted Adam Smith.