The Phillips Curve says that there is an inverse relation between unemployment and inflation. Low unemployment is correlated with a rise in inflation. It’s an article of faith to economists of all stripes. It’s listed in the popular introductory economics textbook by N. Gregory Mankiw as one of the Ten Things All Economists agree on. It’s especially loved by the Fed, which raises or lowers interest rates depending in part on its predictions. Its critics point out that its predictions are poor.
In this post, I discuss the derivation of the Phillips Curve, its adaption by Samuleson and Solow to manage the economy, its breakdown in the 1970s, exploitation by neoliberals of that breakdown to replace Keynesian demand-based economics with monetarism and supply-side economics, its rejuvenation, and the evidence that it doesn’t make accurate predictions.
I conclude with some observations based on an important paper by Simcha Barkai that challenges the core beliefs of neoliberalism. It suggests we can raise wages substantially without causing inflation by lowering corporate profits.
History
This part is based on Sections I-III of Robert Gordon’s article, The History of the Phillips Curve: Consensus and Bifurcation, Economica (2011) 78, 10–50 (behind paywall, but you can find it online at your local library). Gordon is an economics professor at Northwestern and has worked on the Phillips Curve for decades.
William Phillips published a paper in 1958 showing a correlation between wage growth and inflation in the UK between 1861 and 1913. He fitted a curve to the data, and then compared that curve to UK data from two later periods. There was a remarkable similarity for most of the two periods, with exceptions Phillips explains away. Here is the curve Phillips derived:
1. wt = -.90 + 9.64U-1.39
Gordon says that “… the inflation rate would be expected to equal the growth rate of wages minus the long-term growth rate of productivity.” P. 12.
1a. p = w – k
Here p is inflation, w is wage growth, and k is productivity growth. Generally in these equations, lower case letters are rates of change and upper case letters are levels. We can substitute Equation 1a into Equation 1 to get the original Phillips Curve.
2. p = -.90 + 9.64U-1.39 – k.
Paul Samuelson and Robert Solow picked up on the Phillips paper with a paper of their own in 1960. Gordon says much of their paper is a discussion of pre-Phillips theory. They can’t find data on the US economy similar to that found by Phillips for the UK economy, so they work up some of their own data and make some calculations showing a result similar to that of Phillips. Whereas Phillips does not mention the possibility that the curve might shift, Samuelson and Solow find such shifts and offer possible explanations, such as strong labor unions.
Here’s a schematic drawing of the Phillips Curve from Wikipedia:
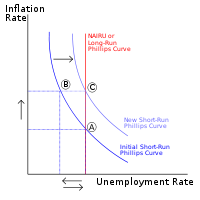
The standard curve might be the one on the left. It shows very high inflation at very low unemployment, but falls quickly as unemployment rises. That suggested to Samuelson and Solow that there is a trade-off if the economy is in specific parts of the Phillips Curve: by allowing a slightly higher level of inflation, you could get a big drop in unemployment. The US tried this idea in the 1960s. This policy was tied to Keynesianism, which was the predominate theory in the Kennedy and Johnson era, and into the Nixon Presidency.
When OPEC massively increased the price of oil in the early 70s, inflation soared far past the level suggested by the Phillips Curve. The neoliberals at the University of Chicago argued that the failure of the Phillips Curve proved that Keynesian economics was worthless, and pushed their solution: monetarism. They also had a formula to replace the Phillips Curve as a predictor of inflation.
Their explanation for the failure of the trade-off was something like this. Suppose the beginning rates of inflation and unemployment are at Point A on the above chart. The Fed lowers interest rates resulting in a small increase of inflation, so that the economy moves to Point B with lower unemployment. People believe that is unsustainable, and that the economy will revert to the natural rate of unemployment, the vertical line. As a result, the Phillips Curve shifts up and to the right over time, so that the economy moves to Point C, with the beginning unemployment rate but higher inflation.
The neoliberals won. Keynesianism lost out and was replaced by monetarism. This was probably not deserved, according to Gordon. He says that Samuelson and Solow were not talking about the situation that came about in the 70s, but rather the situation in the early 1960s. He also spends a good part of his paper showing that the formulas offered by Friedman and the neoliberals for predicting inflation were a total failure both on factual and theoretical grounds.
Gordon himself proposed a version of the Phillips Curve designed to deal with the problem of supply and demand shocks like the Oil Shock:
3. p = Ept + b(Ut – UtN) + zt + et
In Equation 3, the second U term is the natural rate of unemployment, zt represents cost-push pressure, and et is apparently a constant. The natural rate of unemployment and the z term vary over time, and for some reason so does the e term. There is nothing left of the wage term. The Phillips Curve is now free from the bonds of factual data that gave Phillips his interesting result. It’s a curve-fitting exercise, using economic theories put together in a way that fits the data. It’s a complicated formula in which every term needs to be calculated from some other theory or data.
Gordon says that Equation 3 is the canonical version of the Phillips Curve. It is incorporated in most econometric models, modified by some other variables and terms, including levels of taxation, expectations of inflation, inflation inertia, which relates to price and wage rigidity in the short run, and a host of other terms. But as we shall see, it doesn’t work as a predictor.
Criticism of the Phillips Curve
The Phillips Curve has been controversial for a long time, as Mankiw admits in his introductory textbook. Ben Leubsdorf wrote a very readable criticism for the Wall Street Journal on August 14, 2014, just before the Fed started raising interest rates. His title is The Fed Has a Theory. Trouble is the Proof is Patchy (sadly behind a paywall; it’s available online at your local library).
Leubsdorf confirms that most economists believe that there is a short run trade-off between inflation and unemployment and also agree that this trade-off doesn’t hold in the long term, meaning that we can’t get permanently lower unemployment by accepting a bit more inflation. But the problem is that there is also no apparent connection in the short run either. Here’s a chart originally in Leubsdorf’s article and reprinted in a post discussing the article by Jared Bernstein.
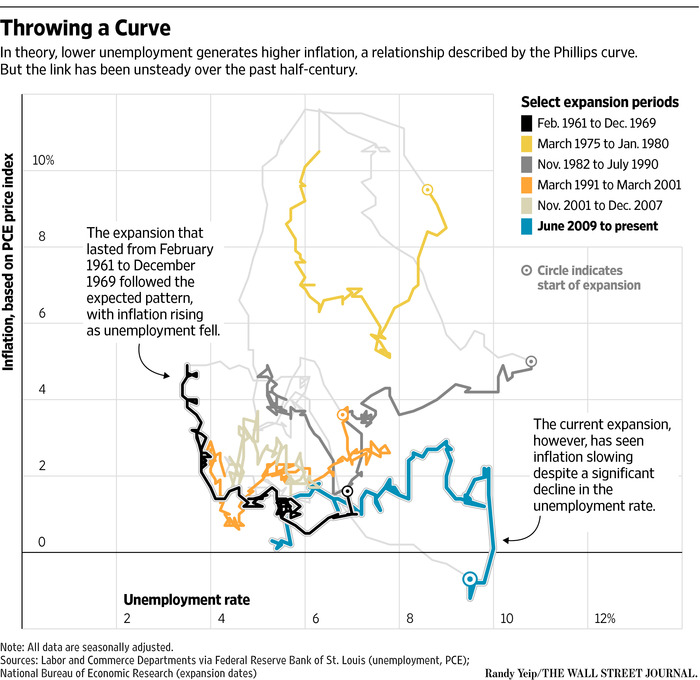
Source: Wall Street Journal
To read this chart, select an expansion period from the list on the upper right, find the line that color, and locate the circle at one end of the line; that’s the starting point. Then follow the line to see how the relationship between unemployment (x-axis) and inflation (y-axis) changes over time. As you can see there is no apparent connection in any except the first expansion. The lack of connection to theory is especially obvious in the current expansion.
The Leubsdorf article has several quotes from Very Serious People to the effect we think there’s a relationship and we’re going to act like there is a relationship, and we can fine-tune the economy with our gut instincts.
It doesn’t look like the latest study will change minds either. That one comes from the Philadelphia Fed in August 2017, Do Phillips Curves Conditionally Help to Forecast Inflation? The conclusion is that the Phillips Curve does worse than something called a univariate model which I won’t discuss.
In this September 26 New York Times article there are more Very Serious People explaining they need to follow their instincts about the economy in deciding on interest rates and they are sure inflation is coming. Meanwhile, the economy continues to add jobs with no obvious increase in inflation as shown by the blue line on the above chart. Inflation is currently running at 1.3%.
Damage From the Phillips Curve
We have already seen that the first notable failure of the Phillips Curve was used to undermine Keynesian economics in favor of monetarism. As a result, working people of all classes were doubly harmed, first by the abandonment of the Fed of any significant role in cutting unemployment, and second by the savage use of high rates to control inflation.
Here’s a chart showing the labor share in gross national product on the left axis (blue line) and the prime rate on the right axis (red line).
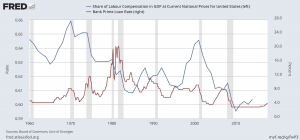
The grey bars are recessions. This chart shows that up to 2000 every time workers start to get a bigger share of the GDP, the Fed raises interest rates. The Phillips Curve was the justification for those rate hikes. There is some evidence wages are firming up today, and maybe even rising a fraction faster than inflation. Following tradition but not evidence, the Fed is raising rates. If that hurts workers, also in accordance with tradition, that’s just too bad.
Observations
Take another look at Equation 1a. If we set inflation at zero, Equation 1 says that wage growth equals productivity growth. That’s not true. Here’s a chart from the Economic Policy Institute.
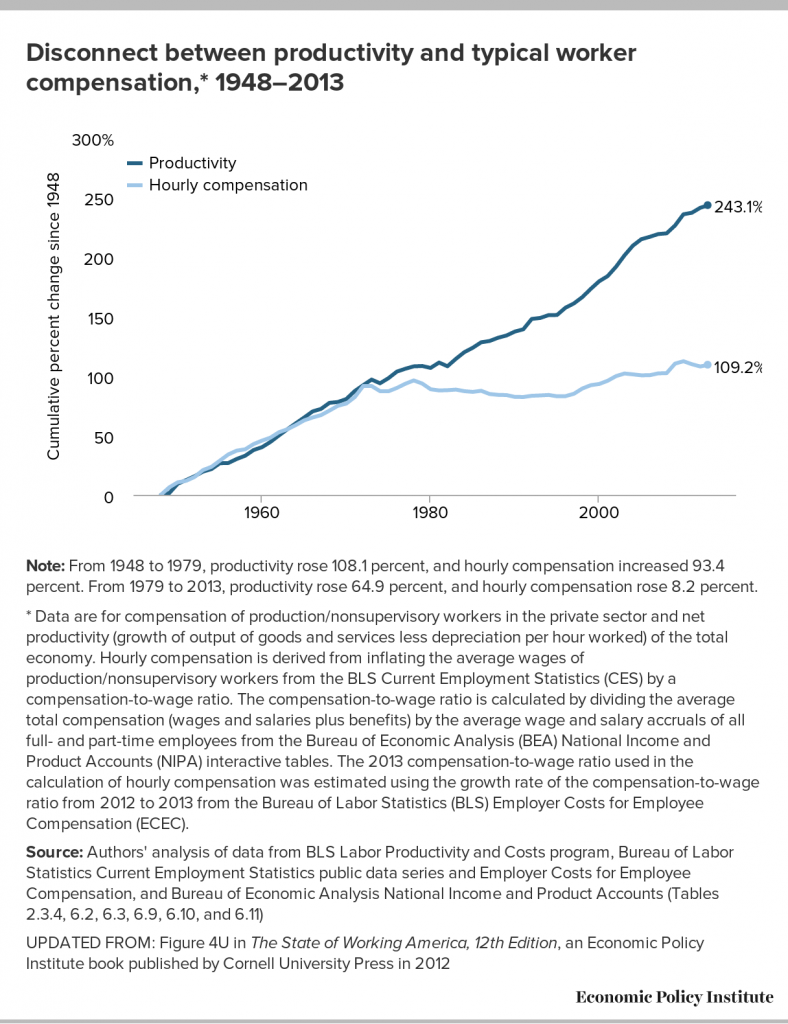
The wage line is for production and non-supervisory personnel, which the EPI says is about 80% of employed people. The average wage for all workers has grown somewhat faster, but is still well under the rate of increase of productivity over the long term.
Money produced in the economy goes either to capital or labor. So, the excess gains from productivity must be going to capital.
Actually, it seems strange to suggest that none of the gains from increased productivity go to capital, as Equation 1a does. Consider a company like Google. It can buy a few more computer blades and serve more customers with little or no increase in total wages. The gains from the productivity of the new capital all go to the company. Or consider a company that outsources its labor. Some of the gains might be used to cut prices, I suppose, but surely most of the gain stays with the company.
The following chart shows the sudden growth in top wealth. It demonstrates that the growth began at the same time as the productivity-wages gap began, more support for the idea that the gains from productivity are going to capital.
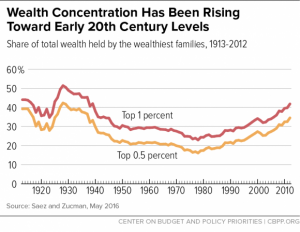
Capital can take many forms. It could be plant and equipment, commercial or agricultural land, personal residences, art, gold, and many other things believed to store value, whether or not they are actually producing anything, or even whether they actually store value. We know that top wealth is rising, the stock market is up, and the value of residential real property in all major cities is rising. All these and more suggest that the total amount of capital is increasing. All that increase is funded by the gains from productivity.
A recent paper by Simcha Barkai, Declining Labor and Capital Shaes, provides a convincing explanation. The labor share is declining he says. But so is what he calls the “capital share”, a defined term, calculated by multiplying the “required rate of return” by the capital stock deployed in the non-financial business sector. Capital stock includes plant and equipment, land, and intangibles such as patents and software, less depreciation. The required return on capital is approximately and sensibly defined as the cost of obtaining capital in the financial markets. He shows that the cost of capital has declined by 7% over the period of his study, 1984-2014. If the amount of capital deployed had increased as might be expected with this large drop in cost, the capital share might have remained the same. Instead, businesses did not deploy additional capital, and the capital share declined by some 30% over the period. During that period the labor share declined 10% from a larger starting point.
The combined losses were more than made up by increases in the profits share. Profits add to the value of the firm, and are distributed by the owners of firms as they see fit, which isn’t to lowly workers. This is from Barkai’s paper:
Across specifications, the profit share (equal to the ratio of profits to gross value added) has increased by more than 12 percentage points. To offer a sense of magnitude, the value of this increase in profits amounts to over $1.1 trillion in 2014, or $14 thousand for each of the approximately 81 million employees of the non-financial corporate sector. P. 3.
Barkai attributes this almost entirely to increased concentration of US industries, and most of the paper is devoted to proof of that conclusion. He links that increase in concentration to changes in anti-trust law and policy engineered by Robert Bork when he was at the University of Chicago.
Conclusion
Following Barkai, we should rewrite Equation 1a like this:
1b. p = w + γ + ct – k
where γ is the rate of growth of the profits share, ct is the rate of growth of the capital share, w is the rate of growth of wages, p is inflation, and k is productivity. Substituting the original Phillips equation, Equation 1 into Equation 1b gives us
4. p = -.90 + 9.64U-1.39 + γ + ct– k.
This equation calls attention to the role that profits play in the economy, something economists generally generally ignore. When people do discuss profits, it’s always in the context of the importance of capital and the need to coddle it. That view lies at the heart of neoliberalism, and at the heart of Fed policy. It is also at the heart of the Law and Economics movement also spawned at the University of Chicago, a movement that has changed the legal system to favor capital. If neoliberals were intellectually honest, they wouldn’t call it supply side economics, they’d call it philo-capital economics.
Equation 1 has been replaced by Equation 3 in the standard model of the Phillips Curve.
3. p = Ept + b(Ut – UtN) + zt + et
Making this work with Barkai’s analysis is harder. We get a clue from Gordon’s explanation of the z term: he call it cost push, meaning price shocks caused by labor unions and “bauxite barons”. This is where capital growth fits in. The ability to control markets gives firms the ability to cause price shocks, as when pharmaceutical companies drive up the price of epi-pens or other drugs, but also the ability to gradually increase prices above the rate of inflation. Therefore, I’d rewrite Equation 3 this way:
5. 3. p = Ept + b(Ut – UtN) + γ + ct + et
Gordon doesn’t explain the e term, so we’ll just let that pick up anything that used to be in the z term that is somehow missed by my addition. It would, for example, include demand-pull inflation, which hasn’t been a problem for some time.
In the current situation, with profits at very high levels, we can easily increase wages without increasing inflation if the rich were willing to accept lower profits, subject to the availability of sufficient resources to meet the new levels of demand substantially higher wages might cause.
Barkai says just distributing the historically high profits to workers would give every working person (other than those in the financial sector) a $14K raise. That dwarfs the make-believe $4K-9K per household the Republicans promise from their proposed tax cuts.
Unfortunately, the Phillips Curve isn’t the only thing blocking action to help the average citizen.


Economists will tell whatever story, with whatever rationale that fits their story, to please their pay-masters.
Just like court magicians or priests divining augers for their emperors
They try to predict the future of a chaotic system, which is impossible.
Telling the rich and powerful what they want to hear is both possible and profitable.
I am constantly baffled by economists trying to explain very complex non-linear system with simple two variable models. I have been dealing with a couple of engineering problems today where the publication I am using has over 50 design charts just for gravity pipe flow. Each chart has about five variables accommodated while holding a number of others constant.
So I believe the Philips curve is valid but it is in a different place in multi-variable space each decade or so based on fundamental changes in the economy. Over the past thirty years, I can think of four major changes off the top of my head that lead me to expect the Philips curve to translate in multi-variable space:
1. Free trade agreements (NAFTA etc.)
2. Technology displacing workers
3. Baby boomer demographic moving from entering peak productivity to retirement age
4. Women and minorities are becoming more widespread throughout most or all jobs.
So workers to day are now competing more with Second and Third World workers while technology is dramatically changing the workplace (e.g. secretarial positions dramatically reduced), and inexperienced 25 year old white men, women, minorities are being hired to replace experienced 60 year old white men. Why would we expect to have a nice linear relationship between unemployment and wages across this period?
So I think we see the Philips curve predictably happening in the short-term in fields like technology where there is big demand and not enough people. However, as a general rule across the economy, I simply don’t see why the relationship between inflation and unemployment should be the same today as it was in 2007, 1997, 1987, or 1977.
Economics is infected with too much ideology and not enough scientific method. That is more the definition of a religion than a science.
rd, the Phillips curve isn’t valid. There is no such trade off. Bill Mitchell has a blog post on this very subject. I am sorry that I do not have it to hand.
I recommend Mitchell and Muysken’s “Full Employment Abandoned.” They harpoon the Phillips Curve, the ‘natural’ rates of unemployment and interest, NAIRU and more.
Good article. In my econ undergrad, I remember my intermediate macro professor pointing out that reality didn’t match the theoretical Philips curve very well…and then we continued assuming that it did, for the remainder of the course. {facepalm}
Might I suggest “capitalphilic economics”? Seems to roll off the tongue a little better.
…80’s Poly-Sci defined, “neo-feudalism”…(or, as “Shock Doctrine”, privatization of all “resource” + government capacity, subject financial sector capture)
I’ll just leave this here along with a little deep thinking by diptherio…
https://www.nakedcapitalism.com/2016/05/naked-capitalisms-diptherio-discusses-flaws-in-unemployment-reporting.html
diptherio
Doncha just love how it’s defined, in practice, as whatever the unemployment rate seems to settle around. If I’m not mistaken, in the 70’s NAIRU was considered to be 6 or 7 %. Then unemployment fell and inflation didn’t accelerate so they changed NAIRU to 5%.
What I want to know is if there has ever been a documented case where it can be shown that low unemployment levels actually led to accelerating-inflation. The inflationary periods in US history that I’m familiar with seem to have all been caused by supply shocks (i.e. oil embargo) or financial shenanigans (the housing market of the early aughties). Ditto for other countries, so far as I know.
As far as I can tell, the whole idea of NAIRU is strictly an artifact of economic modeling, not something that’s actually ever been observed in the wild. And doesn’t it seem odd that making sure we don’t drop below NAIRU is something the Fed feels like it needs to intervene to ensure…rather than letting the market sort it out. Even if NAIRU was a real thing, you would assume that low unemployment –> increased wages –> increased prices –> reduced consumption –> lay-offs and higher unemployment. Which is to say, if there were such a thing as a natural rate of unemployment, wouldn’t markets naturally produce it, obviating any need for the Fed to, say, jack up interest rates to keep the economy from “heating up” (I guess because people have so much money burning holes in their pockets?). It almost like, when it suits the capitalists, they stop believing in this whole “invisible hand” thing….strange…
*blushes* Applying simple logic to mainsteam economics is always entertaining…when it’s not maddening…
If I remember right, Phillips published this paper because LSE was pushing him to publish something so that they could justify awarding him professorship and tenure, and he could go to tinkering with his MONIAC. I was told he just wanted to get something out, and this was the first idea he had so he wrote it up, but wasn’t really persuaded..
The damage to the real world the academia demands does..
“Real world” powers can riffle through the files of academia, hard and soft sciences or the various humanities or whatever, even languages and linguistics, and, because “freedom,” can always come up with something published that “proves” whatever line of BS the looters are pushing at any given moment to increase their “take.”
But then ever since humans discovered ratiocination, thus it has always been. SOMEone or SOMEthing always has to be “the authority,” or at least “authoritative…”
That story puts a new spin on “publish or perish”, something like “(you) publish and (a lot of other people will) perish (sooner)”.
This is one reason why America is being parasitized by finance —- Math. That and the math card in computers that allows the instantaneous creation of speculation and playing of the numbers with hypothetical money that later translates into real productivity or more likely misery.
The average American’s eyes glaze over as soon as you put up a math formula. He of course, will memorize all manner of arcane sports trivia and statistics, but when it comes time to quantify his own economic doom, or to think about his or her own economic travails with numbers and curves, it’s mind shutdown time.
This is why we love Yves. She has allowed us to get an insight into, become informed and learn about economics through high quality reporting. Thank you for this reminder of the hocus pocus and the witch-doctory that is casting our spell into economic hell.
…not just “math”: Rand-Friedman-libertarian ideological definition:
“Neoliberalism sees competition as the defining characteristic of human relations. It redefines citizens as consumers, whose democratic choices are best exercised by buying and selling, a process that rewards merit and punishes inefficiency. It maintains that “the market” delivers benefits that could never be achieved by planning.
Attempts to limit competition are treated as inimical to liberty. Tax and regulation should be minimised, public services should be privatised. The organisation of labour and collective bargaining by trade unions are portrayed as market distortions that impede the formation of a natural hierarchy of winners and losers. Inequality is recast as virtuous: a reward for utility and a generator of wealth, which trickles down to enrich everyone. Efforts to create a more equal society are both counterproductive and morally corrosive. The market ensures that everyone gets what they deserve.
We internalise and reproduce its creeds. The rich persuade themselves that they acquired their wealth through merit, ignoring the advantages – such as education, inheritance and class – that may have helped to secure it. The poor begin to blame themselves for their failures, even when they can do little to change their circumstances.
Never mind structural unemployment: if you don’t have a job it’s because you are unenterprising. Never mind the impossible costs of housing: if your credit card is maxed out, you’re feckless and improvident. Never mind that your children no longer have a school playing field: if they get fat, it’s your fault. In a world governed by competition, those who fall behind become defined and self-defined as losers.”
https://www.theguardian.com/books/2016/apr/15/neoliberalism-ideology-problem-george-monbiot
That you suffer from parasites is your fault, but God help you if you try to eradicate them.
Your link dances around calling it out: neoliberalism is a rebranding of social darwinism.
Not much “neo” about it. But for all the alleged “progress,” it seems we’re trapped in a culture that really finds it hard to let go of the 19th Century. And mot just economically, but socially as well.
“natural hierarchy of winners and losers…” – does not exist. They rebranded to try to get around all the artificial selection in the global economy.
In an early draft of this article, I had a reference to Econned, where Yves discusses the use of the Gaussian Copula in the organization of RMBSs. So, yes, it’s largely the math that Samuelson and Solow and the people who came later loved.
You’ll note that I only use very simple math, mostly because it’s a nice shorthand, like Equations 1a and 1b
an aside: For readers who do not ‘read math’ you provide understandable English translations of the equations. Thanks.
Issue with the copula were nonesense assumptions. Its not the mathiness but bad math again and users who were using it as a trick against the non-mathy.
Turn it around. The math that’s thrown around in some of economics isn’t math at all — it’s heuristic curve fitting. The real math would be really, really hard, but the economist are taking phrases like “inflation is wage growth that is higher than productivity growth”, then mystify it by turning it into an algebra 1 equation.
The phrase already tells you they’re just throwing out a feeling they have — why should inflation be directly coupled to “excess wage growth”? What if you have high productivity growth for a few years without wage growth, and then you have wage growth without high productivity growth? And which is the cause and which is the effect? Most middle-school algebra doesn’t have cause and effect – just a first order connection.
The problem isn’t that they’re using math — it’s that they’re not using math, they’re using mathematical formulations to bamboozle people. And you know it’s bamboozling, because real math for these kinds of problems is really hard. It hasn’t looked like x = y – z for most interesting problems for 200 years — pre-Newton even. Definitely pre-Boltzmann.
We need more math, not fake math.
vlade hit on a key point, IMO. I was an undergrad at prestigious Midwestern school during the period where they split the Econ department in 2 — a econometrics-esque degree from the Math/Science school, vs. ‘Economics’ which they kept in the College of Arts and Letters. They’ve been strangling the latter department since while ensuring steady flow of grants to the math-based department, a la the Phillips story alluded to above.
Seconding diptherio – I remember the introductory statistics and econometric courses I was required to take, where we’d routinely dissect econ reporting in the press based on flawed mathematics or poor statistical methods, and yet carry as though these were meaningful and useful figures (e.g. unemployment, inflation).
So what to do — do you try to change the way economics is practiced? Or do you try to take away the influence that neoliberalism and/or industrial capitalism have on the education fields? And how exactly do you do that (reform education) given how instrumental it is for neoliberalism to continue.
I see an analogy here, maybe I am wrong. Picture bull-fighting, an appropriate concept,I think. I see neoliberalism as the Matador, education as the cape, and the public as the bull. So the questions above might be rephrased as … from the bull’s perspective, do you chase the cape or gore the matador?
The stakes are high for the matador — although as a spectator that fact is hidden in plain sight.
Thanks for this very readable and important post. Demystify the Phillips Curve and other economic “truths” being used against Main Street is significant.
” This equation calls attention to the role that profits play in the economy, something economists generally generally ignore. When people do discuss profits, it’s always in the context of the importance of capital and the need to coddle it. That view lies at the heart of neoliberalism, and at the heart of Fed policy.”
When you think about it, the PC supports the argument of how Supply & Demand explains pretty much everything about economics. It you need to explain economics in a nutshell to a working guy who thinks nothing is really all that complicated (were it not for intellectuals over-thinking things), it fills the bill rather nicely. A matter of rhetorical Supply & Demand, come to think of it.
For most people, being confronted with “scientific evidence” is enough to lay to rest any and all doubt about the claims being made in a proposition. Scientific evidence hardens claims into hard facts, and does so quickly. What better way to make something appear scientific than to riddle its academic literature with curves and formulas, and give it its own pride of place at the nobles side by side with real sciences. That real sciences have laws that are universally applicable or can at least be reconciled across levels of reality with the consistency you’d expect of something labelled a science (e.g. how quantum electrodynamics reconciles classical electrodynamics at the atomic and subatomic levels) seems to be a minor inconvenience to those with vested interests in having economics accepted by the public as a hard science (precisely, I say again, because presenting “scientific evidence” with formulas and curves disarms most people, among them the political ruling class, of their critical thinking faculties). Add living in an age of credentialism to the mix and the general ineptitude of our ruling politicians and one can see how economists can wreak so much havoc with their ex-cathedra pronouncements on what makes the economy work…
The material about Simcha Barkai’s paper is the most interesting part of this to me. That paper strikes a serious blow at the heart of neoliberal antitrust law, but it also explains the wage-productivity gap and shows the way to social changes that would benefit most of us.
Also, the billionaires of the world now control $6 Trillion. https://www.theguardian.com/business/2017/oct/26/worlds-witnessing-a-new-gilded-age-as-billionaires-wealth-swells-to-6tn
So naturally Republicans want tax cuts for the pig rich.
Phillips Curve has ever been ideological nonsense. Sad to see it alive 30 years later…
The Philips Curve exemplifies the dysfunction created by separating mathematical/quantitative descriptions of an economy from that same lived economy and its history. The PC was originally developed on British data covering a period roughly from ten years after the Crystal Palace Exhibition of 1851 to WWI, and then extended to WWII. Over the same period, literature met Oliver Twist and Alice and her rabbit hole, was jostled by Hardy and Lawrence, and jolted by Joyce, Woolf and Eliot, not least because a woman writer demanded a room of her own. The changes in social, economic and political life were comparable.
The British statistics cover a period when power shifted as dramatically as literature. A suffrage limited to propertied men became universal. The agency, the organization, persistence and determination necessary to create that change was considerable. So, too, a landowning aristocracy, once at the apex of all social, political, legal and economic life, saw its monopoly shrink, or rather found itself joined by large business owners, financiers, traders and press lords, and for a time, trades union leaders.
Parliament expressed that power shift, for example, by ending tariffs protecting domestic grain production, substituting, instead, subsidies for imported food stuffs, in order more cheaply to keep workers fed and at their machines. (A hard-fought concession to a new, competing power block of manufacturers, their financiers and traders,) A major constitutional crisis in 1910-11 presaged adoption of Bismarckian welfare programs, which America did not see until FDR and LBJ. These were a modest but viciously fought concession in order to avoid the kind of extra-constitutional change experienced by Russia a few years later.
Workers over this period witnessed the final stage of enclosures (privatizing of common lands), the end of cottage industries, and the rise, dominance and decline of heavy industry. The Crystal Palace’s startling iron pillars and acres of glass yielded to curtain walls and structural steel. Technology, as today, raced headlong. Stage coaches gave way to steam railroads; the telegraph to the telephone and wireless; lances, swords and muzzle loaders to dreadnoughts, flying machines, automatic weapons and poison gas – all with vastly different supply chains, need for capital and levels of employment.
The empire added half of Africa, notably South Africa and its ores, diamonds and gold, and de facto control of Egypt and its canal at Suez. De jure imperial relations existed with India and the “white commonwealth” countries of Canada, Australia, New Zealand and South Africa (post-Boer War). De facto imperial relations existed with much of Latin America, the Caribbean and East Asia. The pound was a global currency and the Royal Navy was admonished to “rule the waves”, an aspiration that has since given way to following and buying from the stars and stripes. The ebb and flow of imperial power affected raw material prices coming in and export prices going out.
By what logic would the statistics of economic relations, of changing notions of acceptable levels of employment and inflation (capital’s nemesis), not be affected by dramatic changes in social, political and economic conditions? Demonstrating sufficient continuity to establish a “law” for those relations for a single country, let alone one valid across time and national boundaries, would seem to be a sisyphean task.
Wonderful post. The samples sampled are slices of time which will never return, yet the curves tell us that they will only return.
There’s a persuasive interpretation of Phillips’ original work and application to US data by John Hussman, which argues:
1) Phillips’ original paper is right but most of the work since is garbage which missed the point.
2) Phillips’ correct result is a relationship between unemployment and real wage growth (“wage inflation”), not consumer prices. Hussman graphs THIS relationship quite neatly.
3) Most modern interpretations have either incompetently lost the point about real wages, or deliberately obfuscated the issue. (Modern econ exists to serve capital more than labor, so this is not surprising.)
Hussman followed up the original piece with some others in recent years:
2013 / 11/ 04
2014 / 08 / 25
The True Phillips graphs in these two articles are much more compelling than the ones posted here on N.C.
And from January 19, 2010 (emphasis added): “When labor is scarce (low unemployment), the price of labor tends to rise relative to the price of other things (thus we observe real wage inflation). In contrast, when labor is plentiful (high unemployment), the price of labor tends to stagnate relative to the price of other things (real wages stagnate).”
Whether real wage inflation translates into consumer price inflation depends on the supply and demand of consumer goods, repayment of debts, workers’ need to save for retirements etc. The “false Phillips curves” from the original post here on NC (which are also in Hussman’s work as examples of what not to do), which plot unemployment vs. consumer price inflation, show that there’s not a large linkage.
I believe real wage growth, at the expense of corporate profits, is exactly what has been missing from the health of the economy for the past 20-40 years.
I also suspect the true reason why central banks fear low unemployment is because those increases in workers’ wages will come at the expense of corporate profitability. (Especially in an economy with high corporate profit levels and inadequate price competition.)
I also suspect most modern recessions have not been caused by the low unemployment, but rather by the credit tightening applied to prevent low unemployment – to prevent workers from enjoying higher wages at the owners’ expense.
Thanks. From the August 25, 2014, Hussman article that you cited:
Never let the facts get in the way of a convenient, wrong argument that supports what policy makers and their patrons want done. Protect capital. That the Fed has an equal responsibility to promote employment seems to have been pixie dusted away.
Thanks for the links. The move from Phillips’ data and curve and presumably Hussman’s into what we now call the Phillips Curve is mediated by Equation 1a, which is what I think they got wrong. I wonder what would happen with my Equation 1b, derived from Simcha Barchai’s work.
Concur. Price inflation is affected by many factors, and the “long term” can be many decades in duration. A graph of the historical values of the terms in Equation 1a could be very enlightening. I bet the “p” implied by “w-k” bears no resemblance to actual “p” on most timescales. (It doesn’t help that we don’t know how to even measure “p” properly!)
Among the many factors that might confound that model, one factor of interest is the fraction of national output received by workers as wages vs. the fraction retained by corporations. There is FRED Graph data on this going back to 1950, which is graphed monthly in the National Economic Trends report by the St. Louis Federal Reserve. The data shows a range of around 6% of national income. (This does not include demographic effects such as the concentration of the remaining “workers” income in the hands of fewer workers, at the expense of the middle class.) When workers receive less and less of what they produce, they lack the purchasing power to push up prices. In times of suppressed wages, I theorize that unemployment can be low without driving consumer price inflation, until wage “inflation” catches the workers’ share of the economy back to historical norms. Conversely, and as seen in this data for the 1970s, when workers’ share of the economy is above its historical average and rising, price inflation can be exacerbated.
What the F(amily blog) happened in the early to mid 1970s where the sharing of productivity increases disappeared? Is it leaving the gold standard? Was there some other massive policy shift that could so decisively alter the prior reasonable trend?
This is a great question. Speaking for myself, the wage-productivity gap is directly the result of the imposition of neoliberal ideas about deregulation, crushing unions, outsourcing, and a host of other similar structural changes. There are also cultural changes, so that people distrusted the government and did not demand heavy regulation and enforcement and somehow came to believe they were entrepreneurs of the self. Over time, the effect of these changes caused the gap.
Barkai shows that concentration of industries is the direct result of changes in the anti-trust system, and that the gap is larger in more concentrated industries. Again, this is partly cultural change. People weren’t worried about these gigantic businesses before the Great Crash, and the Obama Administration did nothing about anti-trust until the end of his term. The current crowd of bozos is hopeless.
I buy Ugo Bardi’s analysis over at Cassandra’s Legacy:
An asteroid called “Peak Oil” – the real cause of the growing social inequality in the US
This has to be part of any explanation, IMHO.
I was managing farms in Iowa in 1970. That year, due to a southern hurricane, southern leaf blight was blown into the Midwest resulting with the devastation of that year’s corn crop throughout the Midwest corn growing area. Corn prices soared as well as wheat, soybean prices, due to the need to replace the food content of corn plus the myriad other uses of corn.
In addition to the local uses of corn, foreign shipments were greatly curtailed causing not a small panic. I’ve always contended oil price increases and the super inflation ensuing were the result of this devastation. (It took a few years for agronomists to develop seed corn that was immune to that leaf blight).
So, inflation is equal to a power of unemployment (magic number?) minus productivity plus a constant (magic number again?).
Really? It’s simpler than Navier-Stokes? No time terms, no derivatives, basically simple enough to describe with 16th century math? No entropy terms, no bifurcations…
Seriously? They give PhDs for this stuff?
The graph on “disconnect between productivity and worker compensation”, above…the divergence around ’76…the value represented by the gap; is for well-deserved executive compensation? Its a good thing all that value doesn’t go into capital; otherwise corporations might have higher tax obligations.