By Martin Ravallion, Edmond D. Villani Chair of Economics, Georgetown University; Dean Jolliffe, Lead Economist, Development Economics Data Group, World Bank; and Juan Margitic, Ph.D. candidate in Economics, Georgetown University. Originally published at VoxEU
When the poorest gain, the lower bound, or ‘floor’, of the distribution of living standards rises. Using microdata spanning the last 30 years, this column argues that the floor in the US has been sinking, alongside rising top incomes. The floor would have fallen further without public spending on food stamps, which helped protect the poorest in the wake of the 2008 financial crisis.
As is well known, the US is experiencing a marked rise in top incomes (e.g. Piketty and Saez 2017), with relative stagnation of middle household incomes. But what is happening at the other extreme of the distribution? Are America’s poorest families seeing some progress? That is the question this column tries to answer.
Some terminology first. “Top incomes” refers to the incomes of the richest 1%. We refer to the lower bound of the distribution of levels of living as “the floor”. This can be thought of as the level of income below which very few people are likely to be found for any reasonable length of time. This can be above (hopefully well above) the biological floor needed for survival.
If rising top incomes are ‘trickling down’ to the poorest, then we should see the floor rise over time. To see if this is happening, in this column we draw on our research using survey data to measure the floor for the US annually spanning 1988-2016. (Our research has also studied the same topic for the developing world; here we focus solely on the US.)
Measuring the Floor
Standard measures of poverty may reveal nothing about whether the poorest of the poor are being lifted up or left behind (Ravallion 2016). Existing poverty measures (including those that give higher weight to poorer people) can readily fall without any change in the floor or even a decline. Instead, we need to measure the floor directly, side-by-side with the prevailing ‘counting approach’ to measuring poverty.
There are a number of methodological issues in measuring the floor, as discussed in Ravallion (2016) and Ravallion et al. (2018). Most importantly, survey-based incomes are likely to be deceptive. We must recognise the existence of measurement errors in survey data. There are also likely to be transient effects in those data, whereby observed incomes (or consumption expenditures) for the recall periods in surveys can fall temporarily below the floor (for example, due to seasonality, a spell of illness or some other shock), but recover later. Thus, one cannot be certain that the lowest observed income in a survey reveals the floor. Indeed, there is a non-negligible chance that the observed income of potentially anyone within some low-income stratum could in fact be at the current level of the floor. Some form of averaging is necessary.
We follow the approach of Ravallion (2016) in measuring the floor asa weighted mean of the incomes of a stratum of low incomes, above which the floor is very unlikely to be found. For this column, we assume that the relevant stratum is those officially designated as poor in the US, with highest weight on the lowest observed income, and a linearly declining weight as incomes rise up to some point, above which there is no chance of being the poorest. Ravallion et al. (2018) gives results for other measurement assumptions, including: (1) allowing the probability of being the poorest to decline non-linearly as income rises; and (2) using a fixed percentile – the poorest 20% – rather than a fixed real poverty line. The main qualitative results are robust to these options.
In measuring the floor, we use the microdata from the annual Current Population Surveys (CPS) done by the US Census Bureau. We have calculated incomes from the CPS the same way the Census Bureau calculates its official poverty measures. This includes money income before taxes from multiple sources, but excludes some non-cash benefits. Importantly in this context, it excludes a major form of in-kind assistance targeted to poor people, namely, the Supplemental Nutrition Assistance Program(SNAP), often called ‘food stamps’. This is the US’s largest antipoverty programme, covering about 14% of the population. SNAP aims to help poor recipients cover their food spending. We provide estimates of the floor without SNAP, but also when SNAP receipts are added to reported incomes.
The Floor in the US, 1988-2016
Figure 1 gives our estimates of the floor before and after SNAP. Since the official poverty thresholds vary by family size and composition, it is simpler to express the floor as a proportion of the threshold. The mean post-SNAP floor is about 36% of the official threshold. For a family of four, with two adults and two children, the threshold was about $16.50 per person per day in 2015. The floor in that year’s prices is $5.89 a day post-SNAP, while the pre-SNAP value is $5.40.
Figure 1 The floor in the US before and after food stamps
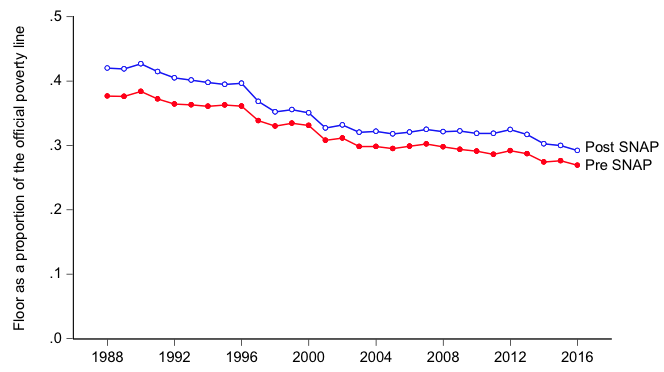
Source: Ravallion et al. (2018).
We see that the floor has tended to fall over time. The trend rate of change in the post-SNAP floor is -1.3% per annum. About half of the overall decline in the level of the floor is in the period 1996-2001, coinciding with various social policy reforms (Ravallion et al. 2018). The floor stabilised over 2003-12. There is no significant trend in the post-SNAP floor after 2003, though the fall in the pre-SNAP floor continued, albeit at a slower pace (Figure 1). However, the last few years indicate a worrying resumption in the floor’s downward path even post-SNAP.
Standard measures of poverty may reveal nothing about whether the poorest of the poor are being lifted up or left behind. This can be seen by comparing Figure 1 with Figure 2, which gives three standard poverty measures – the headcount index, the poverty gap index, and the squared poverty gap index – all using the official poverty line. For example, the periods 1993-2000 and 2012-16 saw declining poverty measures but a sinking floor. And the sharp rise in poverty measures in the crisis period (2008-10) came with a relatively stable floor post-SNAP. The proportionate changes over time in the floor are roughly orthogonal to those for the (post-SNAP) headcount index and are not strongly correlated with changes in poverty gap index or the squared poverty gap index.
Figure 2 Poverty measures for the US
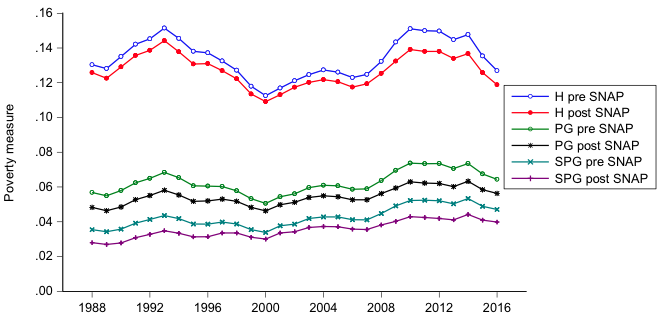
Note: H: head count index; PG=poverty gap index; SPG=squared poverty gap index.
Source: Ravallion et al. (2018).
Divergence Between the Richest and the Poorest
Figure 3 plots the per capita pre-tax incomes of various quantiles, including the top 1% – the income level above which one finds 1% of America’s population. Call this q(99). The figure also gives the quantiles for 95% and 90% as well as the mean and median (q(50)). We see a marked absolutedivergence – roughly speaking, a rising absolute gap between richest and poorest. Figure 4 uses logs instead. While the growth rate of the floor over the period is -1.3% per annum, the growth rate of q(99) is 1.6% per annum. For a family of four, the floor fell from about 9% of q(99) in 1988 to 4% in 2016. So there is also marked relativedivergence.
Figure 3 Absolute divergence between top incomes and the floor in the US
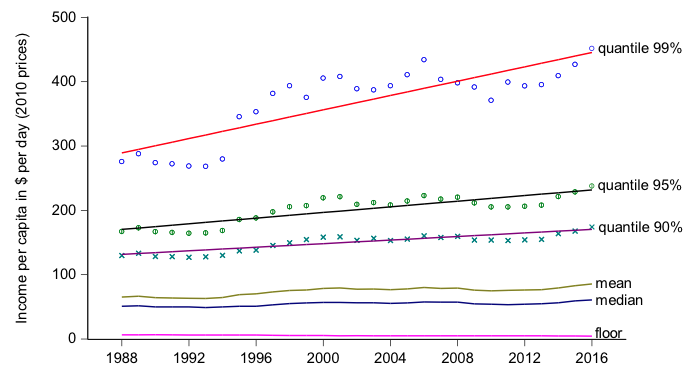
Source: Ravallion et al. (2018).
Figure 4 Relative divergence between top incomes and the floor
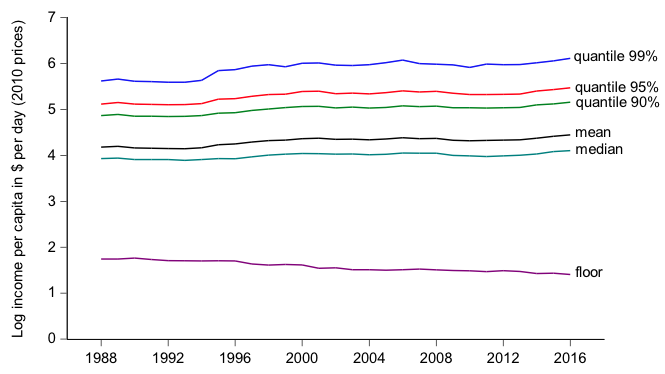
Source: Based on estimates in the same source as Figure 3.
A caveat here is that there is likely to be a downward bias in survey-based estimates of the incomes of the rich. For example, the estimates combining the CPS with income tax and national accounts data in the Worldwide Inequality Databaseindicate a higher growth rate for the top 1% than found using the CPS alone. If anything, the true extent of the divergence is even greater than we see in Figures 3 and 4.
Food Stamps Have Reached America’s Poorest
We see in Figure 1 that foods stamps lifted the floor. Over the whole period, SNAP raised the floor by about 50 cents per person per day, on average. The programme also helped stabilise the floor. Our results suggest that without the ‘SNAP stimulus’, the floor would have fallen even further in the wake of the 2008 financial crisis. Less encouragingly, we also find that the efficiency of SNAP in reaching the poorest (the gain in the floor per dollar spent on the programme) has declined over time (Ravallion et al. 2018). However, it is clear that SNAP has helped America’s poorest.
Is this a form of ‘trickle down’, via public spending on antipoverty programmes? SNAP spending per recipient has grown alongside rising top incomes, though whether the latter caused the former is an open question. More tellingly, SNAP participation rates have fluctuated over time, buffeted by politics and reform efforts, and this has been the main driver of fluctuating SNAP spending per capita of the US population, with the expected implications for the living standards of the poorest (Ravallion et al. 2018). Politics and policies have probably played a more important role than a trickle-down process through social spending.
See original post for references


2nd graph, poverty measures, seems to have a bad parameter (looked at in Chrome and Firefox). When I inspect in Chrome I see:
img[Attributes Style] {
width: 600px;
height: 3902px;
I suspect that height was supposed to be 390, or something similar.
And, of course, I am, reminded of Thomas Frank:
The final graf of the Thomas Frank quote is a brilliant summary of why Trump is president and Hillary is not.
Yep. I see the same problem with the second graph. Native size of the image is 665 x 322.
Thanks for this TF quote. “No floors” means an abyss instead of a safety net.
Thanks NC for the original post.
that Hillary feminism is garbage even as feminism. If we take major feminist concerns like women being able to exist independently of a male benefactor. That is a good thing especially as the latter can mean women staying with abusive partners etc.. It’s a good thing and more opportunities exist in many ways. HOWEVER, enter a recent dark counter-force, lower workforce participation rates in the last 2 decades for both men and women. So if a woman can’t find work because there are no jobs and can’t get much of a government safety net either even with children much less without then this will drive women into staying with men out of necessity (it may do the same thing for males with employed partners). So it drives the very thing feminist are against.
https://www.counterpunch.org/2018/06/21/when-both-men-and-women-drop-out-of-the-labor-force-why-do-economists-only-ask-about-men/
That would be good for our country. Finally our children would have mothers to take care of them and teach them values that have disappeared over the past 2 generations. Responsible motherhood would solve many of our societal problems.
Which implies that our current problems are the result of poor motherhood? Rather than flat wages, cuts in social services and deregulations.
And housing so expensive it requires two incomes to survive.
The return of extended families.
“Feminism” from the 70’s and 80’s was primarily focused on professional women, making it to the top, and making as much money as possible. That automatically left out the millions of nurturing women who wanted to be wives and mothers and left a wide open space for mockery of feminism by both men and women. If a movement is supposed to embrace and focus on women’s issues, it had better focus on lifting up those who need the most help to survive on a daily basis. Lift up their lives and they can also help others. Instead, as Thomas Frank shows, the Clinton version of “feminism” actually increased inequality. Having feminists such as Gloria Steinem making excuses for sexual abuser Bill Clinton also did NOT help the cause.
I don’t understand how you or Frank are trying to connect dots between “the end of welfare as we know it” and feminism. This was strictly a class issue. Please tell me what “feminist” organizations were behind it.
The fact that Hillary Clinton as a person, who was married to and defended a sexual predator, supported it does not count as a “feminist” endorsement. In fact, I’m baffled at how many “professional” women identify with Clinton, since she rode Bill’s coattails. She couldn’t pass the DC bar exam and her position at the Rose law firm in Arkansas clearly depended on her connection to Bill as governor.
As someone who went to college in the 1970s, I disagree with your characterization, in part because there wasn’t even any such thing as “professional women” back then. Harvard Business School didn’t admit women until its class of 1965. Until the 1970s, women were virtually excluded from any work aside from being secretaries, teachers, nurses, retail, and oh, real estate brokers. And the obsession with making lots of money started in the Reagan era, when tax rates were lowered. You are projecting the values of today back on a period when they weren’t operative.
The focus of the early wave of feminism was equal rights and equal access. You seem to forget that abortion rights was also a big focus, and heretofore the only people who could get abortions were those rich enough to go to Canada. That cohort believed you could have it all, a good career and kids. And you seem to forget that teachers had been able to do that, so it was hardly a crazy line of thought.
I object vociferously to you depicting that a “Clinton feminism”. Women having more access to the workforce has greatly increased their ability to escape bad marriages, like to drunks and abusers and men who cheat. Over 70% of all divorces are initiated by women. By contrast, in the early 1970s, divorce was very rare, in large part due to the difficulty of women getting decently paid jobs. You ignore the importance of rising pay equity in similarly-skilled jobs. In 1970, the pay gap was over 40%. It’s now under 20%.
What you also leave out is that it is married women go to some length to ostracize single women, who are typically “professional” women. Singe women are not invited to dinner parties, which are the foundation of social life in suburbs. The assumption is that they want to steal a married man. There are only a few cities in the US where a single woman over 35 is not treated as a second class citizen. So the idea that “professional women” somehow have it against women with kids is utterly backwards. It’s a classic form of projection.
“The assumption is that they want to steal a married man.” ” dinner parties, which are the foundation of social life in suburbs”
Sounds very Man Men’esq.
In my suburb / neighborhood we don’t have dinner parties and single women with and without kids do get invited to backyard events.
I agree with your point about Clinton feminism. Maybe she claimed the mantle and other women in her circle claimed it so many times people tend to believe it?
Good to hear that not every place is like the places I’ve heard women I know lament about. But having backyard events as the anchor of social life requires having good weather most of the year….which isn’t the case in a lot of the US.
There is also the phenomenon of church based social systems. Here Down South, many, if not the most social interactions occur through the mediating influence of Church. The weekly routine of meeting to “Praise the Lord” is a natural centre of the maelstrom of meeting and greeting. Indeed, many places identify a person or family by their church affiliation. In this is subsumed childrens’ indoctrination under the guise of ‘Sunday School’ and religious retreats. When I was a teen in Miami Beach, the jewish children I interacted with had their Temple or Synagogue attendance and related activities. The Bar and Bat Mitzvah ceremonies were a defining point in their emotional and social development. (I went to a few of those. However, the trend was to exclusivity in that regard.)
It being Florida, the phenomenon of backyard barbecues was seen at various levels of the socio-economic hierarchy. In that regard, the rule controlling admission to said barbecues was class based. People of ones’ ‘own class’ were preferred for association with.
Oh, and Tupperware Parties. Let’s not get into that nexus of social association and commerce.
Well, sorry for the rant.
Blast! Skynet just ate a comment placed here.
I ranted a bit about The South and Church based social systems, etc.
One minor nitpick of the above; I’m not sure your statement,”Singe women are not invited to dinner parties, which are the foundation of social life in suburbs).” is 100% correct relative to your explanation of the prime reason.
I’m not sure because, as a single man with the same issue, i.e., not being invited to dinner parties, the cause seems a little off. Even when considered a relatively close friend of both the husband and the wife (inner circle, so to speak), exclusion from dinner parties in Suburbia of singles is a common experience for both men and women.
Unless, of course the assumption is that the hostess wants to steal a single man and the husband is doing the objecting. :-)
But really, all singles are generally left out of dinner parties in suburban life except for the cases where a single cousin or some such is visiting town and the proverbial third wheel, male or female, is needed to round out the table (or the host or hostess swallows one too many cupid pills). At least that has been my extensive and long term experience from NYC and Suburbia, CT. to East Podunk, FL. to West Podunk, CA.
Outdoor summer parties? Exclusion is never an issue. But dinner parties? Single? Male or female, you can forget 95% of them.
But as someone who came of professional age in the mid-70’s, your other points appear to be very accurate to this guy.
The graphic is fixed, thanks.
“Best Buy Theater” is a bit sly, yes?
I don’t need no stinkin’ report to tell me what I’ve seen and experienced daily for 15 years. It varies by state, but in Pennsylvania you are considered poverty-stricken if you earn less than $12,000 a year. That’s when you get decent help with heating costs and some food stamps. If you earn more than that, the help goes down as your income goes up. As I have posted before, my income of $17,000, which varies greatly by month, got me $500 in heating costs (which in the dead of winter would cover four weeks) and the grand sum of $15 in food stamps.
Although what you get is supposed to be based on very strict guidelines re income (and if you have a mortgage or rent), what you actually get varies a lot. My disabled neighbor who gets $700 a month, receives $65 a month from SNAP, while another disabled man, who lives on the same amount, only gets $17 a month from SNAP.
At the same time, incomes for the poor, elderly and disabled have stagnated for years. But expenses for basic living, as well as taxes and services, keep going up. The working class in my area have the same problem, and of course good jobs are hard to find. The results are more houses for sale, more houses foreclosed on, and less money to buy anything. A lot of small businesses are closing, so those jobs are gone too. In addition, if you have no extra money or your credit is bad, when you can get a car loan, the interest and payments will be crippling. Yet you can’t survive in a rural area without a car. And if you put anything on a credit card, the interest eats up all your money and you end up trying to pay off that card for the rest of your life. No wonder the elites loves the current situation.
Yes, a disabled friend, whose income of about $750 and living expenses have NOT changed, was allowed I think $76/month for SNAP last year, but this year when she re-applied was allowed only $50/month. Pathetic amounts for people who have pretty much nothing. I don’t understand why it went down but wonder if the Republicans snuck in reductions.
Sounds just like most small towns in Central Upstate NY, too. I know more than a few in the same position.
Our town has also seen a slow but steady increase in ‘property crimes’ as those on the bottom try any and all means to make ends meet. Local property crime has seen a decrease in the component of ‘hoods’ obviously driven by substance abuse issues.
A modern Victor Hugo would now write a master opus called “Les Deplorables.”
https://talkpoverty.org/2016/09/13/poverty-rate-just-dropped-way-measure-poverty-wrong/
The main reason I don’t trust this approach to measuring poverty is shown in the figure below. In 1963, the poverty line for a family of four was 50% below median family income—or one-half of the income of the typical four-person family in America. Today, however, the poverty line for a family of four is 66% below median family income.
That means to be officially counted as poor today, a family has to be much poorer compared to the typical American family than it had to be in 1963. In fact, if the federal poverty line today was set at the same place relative to median income as it was in 1963 it would be about $33,000, rather than $24,000.
=========================================================
If one has never actually looked at the ACTUAL amount of money below which one is “poor” and one has to fall before there is any assistance, I think the average person would say that it is impossible to live on that amount (it is 12,000$ a year for a single person)
If one doesn’t have relatives, there is another term for the single poor person….”homeless”
12 years ago, when it became too painful to work any longer, I found this out the hard way. at the time, in Texas, a family of four had to make below $321 per month in order to qualify for medicaid.
that’s africa poor, and means a cardboard box(which they take issue with, as well…you need an address).
Of course, disability somewhat fixes this…if you can manage to get declared officially disabled. Took me 6 1/2 years, and 4 times through the whole process, until my “work credits” withered away and I was no longer eligible for disability proper.
then ssi caught me and I got a hip soon after.
I worry about what will happen when my folks die and I get my meager inheritance…or when wife’s(Teacher) salary rises too far for ssi.
I hear rumors of “clawbacks” and the whole mess is predicated on the assumption of bad faith, with constant reminders of what happens to fraudsters.
It’s cruel and all too usual.
and remember, Texas(along with Kansas) is the shining example that certain people want to export to the rest of the nation.
As far as foodstamps…we gave up after a few months. even more intrusive regarding reapplying and updates on “status”, and even more threats and cautionary tales about fraud, and the ever present assumption of evil intent. all that for a food subsidy that fluctuated at random between $20 and 300 per month…that, when used as intended gets you the stink eye everywhere you go.
not worth it.
and I’m one of the lucky ones. all I have is extraordinary pain to deal with…rather than dialysis or cancer(touch wood) or some brain injury.
we should be able to do better than this.
wonder which is greater, the net wealth of say the poorest 10% of americans, or the net wealth of the poorest of the walton heirs.
Reply is not working for me.
@FresnoDan’s comment: Great comment.
Even the government’s unemplyment figures, based on ridiculous criteria, are an affront to anyone with sense.
I witnessed up close the disparaging attitudes of middle class social workers (predominantly women and some men) towards the desperately poor single mother TANF clients struggling to get jobs, childcare and stay one step ahead of the sanctions poised above their heads like Damocles Swords. I can’t say feminist solidarity was prominent. Classist condescension and blame the poor scapegoating was.
Let’s select an economics for globalisation.
Would you choose neoclassical economics?
Mariner Eccles, FED chair 1934 – 48, passes comment the last time they used neoclassical economics in the US in the 1920s.
“a giant suction pump had by 1929 to 1930 drawn into a few hands an increasing proportion of currently produced wealth. This served then as capital accumulations. But by taking purchasing power out of the hands of mass consumers, the savers denied themselves the kind of effective demand for their products which would justify reinvestment of the capital accumulation in new plants. In consequence as in a poker game where the chips were concentrated in fewer and fewer hands, the other fellows could stay in the game only by borrowing. When the credit ran out, the game stopped”
It does what it says on the tin and wrecks the economy through maximising profit and capital accumulation.
It keeps the ball rolling with debt until it ultimately collapses.
Here we go.
2014 – “85 richest people as wealthy as poorest half of the world”
2016 – “Richest 62 people as wealthy as half of world’s population”
2017 – World’s eight richest people have same wealth as poorest 50%
Look at the returns on capital; they are low/negative because there is no demand for it.
Look at inflation; it is so low because of the subdued demand.
Look at global debt levels.