By Federico Diez, Economist, IMF; Daniel Leigh, Deputy Division Chief in the Western Hemisphere Department, IMF; and Suchanan Tambunlertchai, Economist, Western Hemisphere Department, IMF. Originally published at VoxEU
The rise in the market power of large firms is assumed to affect economic activity, but measuring either market power or its effects is challenging. Based on firm-level data for 74 countries, this column shows that market power has increased around the world, driven mostly by ‘superstar’ firms. Higher markups are initially associated with increasing investment and innovation, but the reverse is true when market power becomes too strong. The share of income paid to workers also declines with rising market power.
The large number of corporate giants in industries from the airline industry to pharmaceuticals to high-tech companies raises questions about the effects of market power. Some argue that it reduces economic dynamism and exacerbates income inequality. Others argue that higher profits and economies of scale and scope associated with it spur investment and innovation.
The lack of consensus over the extent and effect of market power is partly because it is difficult to measure it. A standard definition of market power is the ability of a firm to maintain prices above marginal cost, which is the price level that would prevail under perfect competition. Yet we don’t have data on prices and marginal costs for large numbers of firms over time.
Our recent research (Díez et al. 2018)estimates these markups using data from income statements and balance sheets for publicly listed companies in 74 countries between 1980 and 2016. Using Thomson Reuters Worldscope,1 we are able to estimate markups for 33 advanced economies and 41 emerging market and developing economies based on firm-level data. Our firm-level approach, which partly builds on work for US firms by De Loecker and Eeckhout (2017), provides more granular insights into market power than conventional Herfindahl-Hirschman-type industry concentration ratios.
The results suggest that markups among advanced economy companies have significantly increased since the 1980s, by 43% on average, and that this trend has accelerated since 2010 (Figure 1). By contrast, among emerging market and developing economy firms, the rise of markups is a much more moderate 5%, on average, since 1990. These results are broadly consistent with new work by De Loecker and Eeckhout (2018) for 134 countries.
Figure 1 Evolution of estimated markups across economies (sales-weighted mean for all publicly listed firms), 1980–2016
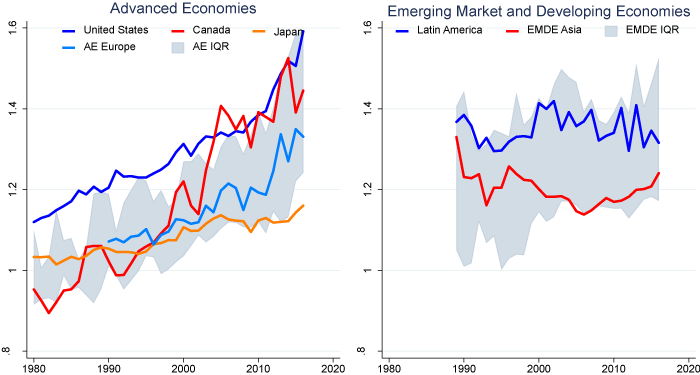
Source: Authors’ calculations based on data from Thomson Reuters Worldscope.
Notes: IQR denotes inter-quartile range.
The increase in markups in advanced economies is mostly driven by ‘superstar’ firms that managed to extract high markups, while markups in other firms have essentially been flat. The distribution of markups has broadened and skewed upward (Figure 2). Interestingly, all broad economic sectors show this pattern.
Figure 2 Distribution of firm markups, 1980 and 2016
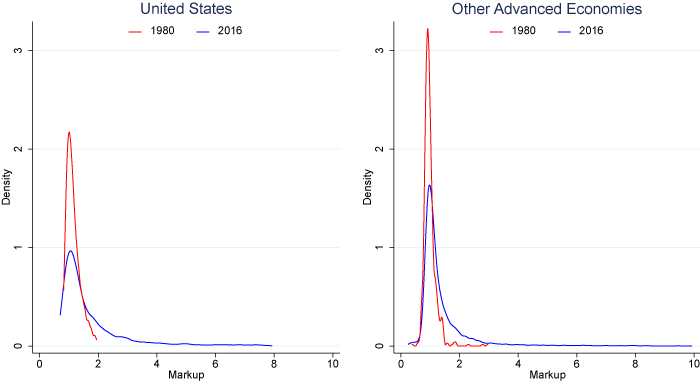
Source: Authors’ calculations based on data from Thomson Reuters Worldscope.
Should We Be Concerned?
The short answer is yes, especially if this this rise in corporate market power in advanced economies continues. We found that, starting from low levels, higher markups are initially associated with increasing investment (capital expenditure) and innovation (research and development), but this relationship becomes negative when market power becomes too strong (Figure 3). This estimated non-monotonic relation is highly robust. It is not driven by any country or industry. Further, the link between markups and investment and innovation is more strongly negative in industries featuring higher degrees of market concentration.
Figure 3 Investment rate versus markup, US firms
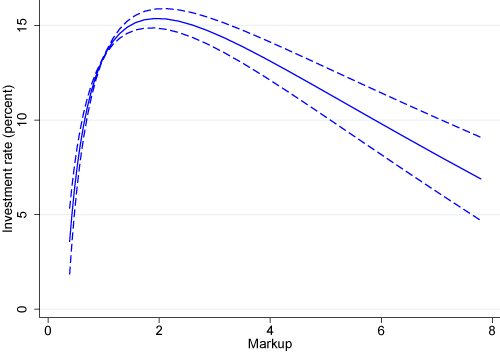
Source: Authors’ calculations based on data from Thomson Reuters Worldscope.
Notes: Figure reports fitted value of investment rate (capital expenditure-to-lagged capital ratio) against markup across sample range of markup. Dashes indicate 90% confidence interval.
We also find a negative association between labour shares and markups, implying that the labour share of income declines, on average, in firms whose market power rises. In other words, when there is higher market power, the share of firms’ revenue going to workers decreases.
Policy Implications
The policy implications of this depend on what has caused this increase in global market power. The factors are still debated. Possible causes include the rise of intangible assets such as software, network effects (when a product’s value to the user increases as the number of users of the product grows), or weaker anti-trust enforcement. More research is needed to discriminate between them.
Authors’ note: The views expressed in this column are the sole responsibility of the authors and should not be attributed to the International Monetary Fund, its Executive Board, or its management.
See original post for references


I wonder if markup is also a function of industry type, and that higher levels of markup might correlate to lower levels of required capital investment.
Software, for example, has an incremental (on the 2nd and subsequent copy) capital cost approaching zero, and finance, which accounts for an outsize portion of US profits has low capital requirements versus its turnover.
While software has almost zero distribution costs, both cost of sales and the sunk development costs are large.
In a direct sales software company, GS&A (General, Sales & Admin) is typically 55% of revenue.
Engineering costs 8% to 12% of revenues, but there are very few, if any, large software development projects under 1 year, and typically large projects span 5 years of more from requirement to first release delivery (Obamacare was a typical large project).
Only is the fevered imaginings of management (UK TSB) or politicians can software be delivered quickly (F 35).
The Engineering trilemma: Fast, Cheap and Good, choose two (If you are feeling lucky).
Figure 1 has a bad image size tag that is causing it to be incorrectly rendered. Actual image size is 700 x 375.
Thanks, Grumpy, this was very helpful.
Case Study: Amazon?
This is a very strange post. Take the assertion: “The lack of consensus over the extent and effect of market power is partly because it is difficult to measure it.” The problem isn’t measuring market power as stated but quantifying market power. I don’t think it’s necessary to quantify market power in order to obtain a measure for it. Checking on a few prices for generic drugs before and after their makers were bought out by larger Pharma provides a clear measure of the market power of a monopoly — “far too much” is a perfectly good measure, just a little difficult to use it for making an attractive graphic chart. Using the standard definition of market power —
“A standard definition of market power is the ability of a firm to maintain prices above marginal cost, which is the price level that would prevail under perfect competition. Yet we don’t have data on prices and marginal costs for large numbers of firms over time.”
— seems a wasted effort. The data isn’t available and such data as is available from corporate reports is based on what I believe is less than trustworthy accounting practice. I think these difficulties would make a proxy like markups an especially poor measure for market power. It also ignores many other components of market power — like the ability to buy-up or destroy competitors, the ability to constrain what products appear in the marketplace, the ability to control innovation to protect investments already made … and it doesn’t even begin to touch upon little matters of industrial consolidation and politics. Suppose one could find a measure of market power that would support an accurate and quantifiable measure for the extent to which market power deviates from Pareto optimality or some other darling of neoclassical economics — which I believe is the underlying purpose of the studies this post reports. Would that measure of deviation tell us anything we didn’t already know? And it ignores so many of the other costs of consolidation. I could go on in greater tedium — but then I belong to a different church of economics than the author of this post.
I find this article to be somewhat of a crock, and would refer people to a paper by Jose Azar, Sahil Raina and Martin Schmalz titled, Ultimate Ownership and Bank Competition.
Although I would posit that their paper wasn’t perfect*** it was lightyears ahead of anyone else.
They covered the concentrated bank ownership (top 6 banks) and demonstrated by way of concentrated airlines ownership just how minute and detailed price fixing and raising could be (covered individual air routes, etc.).
***Where they erred, IMHO, was mentioning Wellington and Berkshire Hathaway in conjunction with bank ownership (they were focusing on BlackRock, Vanguard, State Street and Fidelity, the Big Four investment firms who are the majority block shareholders of everything) and neglected to drill down to find that the Big Four are majority shareholders in Wellington and Berkshire.
https://poseidon01.ssrn.com/delivery.php?ID=742110126119071018098065107098022127062041020052054087069122084029067088031112106088102031125025020116062124081079093122121082057017017032053100083078120112001125087041058031020111000091097122072014006080099023088124120027127010092109030097123122103097&EXT=pdf
BTW, the top 5 to 10 health insurance corporations are also owned by the Big Four, and probably the top 50, for all we know.
see the book “Radical Markets” by Weyl & Poser for more on market power is directing wealth to the 1% .
Well, Duh! In so many words, or less….¯\_(⊙_ʖ⊙)_/¯
Interesting though proof of tie to wages needed.