Yves here. One issue that is important to the “unfair inequality” model the authors use is based on the idea that redistribution needs to be balanced against giving people incentives. The idea of money as an incentive is IMHO overrated, but America is set up to make it way more important than it ought to be. High costs of housing and healthcare lead to a situation where the earnings level needed to be secure (as in being able to pay for necessities and some luxuries, like entertainment and a vacation, and also put away enough for retirement and emergencies) is very high. Add to that if you have kids and want to send them to college, the level of income required is even higher. And that’s before getting to the fact that young people are often saddled with student debt.
On top of that, American has long been plutocratic. Pay is too often seen as the same as worth.
By contrast, in Japan, the disparity in pay level between top executives and front line workers was and is very low compared to America, yet the Japanese are not slackers. One big reason is Japanese companies are very good at creating non-income incentives, like having it be well known which job postings are consistent with being highly regarded. And the perks that confer high status are relatively inexpensive, like (for senior managing directors) having a car and driver and a generous expense account. Another famous example of people working hard for status is the Linux developer community.
By Paul Hufe, Doctoral researcher, University of Munich and ifo Institute, Ravi Kanbur, T. H. Lee Professor of World Affairs, International Professor of Applied Economics and Management, Professor of Economics at Cornell University, and Andreas Peichl, Professor of Economics at the University of Munich. Originally published at VoxEU
Rising income and wealth inequality have come into sharp focus since the Global Crisis. Using US and European data, this column explores the factors contributing to unfair inequality, focusing on equality of opportunity and freedom from poverty. The results show that unfair inequality is greater in the US than anywhere in Europe, and that it has been increasing over time. The findings also show that relying solely on measures of equality of opportunity will severely underestimate unfair inequality.
Every society has income inequality. How much of this is a legitimate target for policy? The answer clearly depends on the principles which underlie our notions of an ethically acceptable distribution of income. One way to approach measurement of ethically unacceptable inequality is through a two-step process. First, we set up an ideal or norm distribution of income which satisfies key ethical principles. Second, we apply a metric for the distance between the ideal and the actual. Both of these steps are normative in nature. This is especially so for the first step, which requires reaching deep into our moral intuitions and our conceptualisations of legitimate and illegitimate outcomes and processes.
Even for those for whom the ideal is perfect equality of income, it should be clear that in practice the ideal is infeasible or undesirable for a number of reasons, including the incentive effects of attempts to redistribute. The Nobel prize-winning contribution of Mirrlees (1971) sets out a framework in which the ideal of egalitarianism in outcomes can be reconciled with incentive constraints. However, a strong strand of the literature argues that over and above incentive issues, which will be present in any attempt to redistribute towards any norm, equality of incomes should not be the ideal to strive for.
With roots in the work of Rawls (1971) and Dworkin (1981a, 1981b), this line of thinking has been crystallised in the work of John Roemer (1998) through the distinction between ‘circumstance’ and ‘effort’ as determinants of income. Circumstance refers to those factors which are outside the control of the individual such as race, gender, parental wealth, and so on,1 while effort is meant to characterise those factors which the individual controls and which in turn affect income. The fraction of variation in income which can be attributed to circumstance is then proposed as a quantification of the degree of ‘inequality of opportunity’ or unfair inequality. In other words, the norm distribution of income is that which equalises average income across the circumstance types. Decomposition techniques then supply the metric of distance, and these can then be applied to data to derive measures of unfair inequality across countries and over time. The methods are relatively easy to implement, which perhaps explains why there is now a veritable mini-industry doing such calculations (see for example the survey by Roemer and Trannoy 2015).
The intuitive power of a division between circumstance and effort in delineating legitimate from illegitimate variation in income, and thence the norm distribution of income which captures the intuition, is very clear. But it is not the only moral intuition at play where income distribution is concerned. Imagine yourself serving on a soup line. As the indigents shuffle towards you and you reach out with soup, you are informed that the devastating outcome you see before you is the result of effort not circumstance, that the person before you had a ‘good start’ in life but ‘blew it’ because of his or her own choices. Would you then pull back your hand and not give out the soup? If not, then clearly some other moral intuition is cutting across the equality of opportunity argument – we call it the ‘freedom from poverty’ requirement.
Put another way, the norm distribution of income should capture both fundamental moral intuitions. On the one hand, individuals should be held responsible for decisions inside their control. However, on the other hand, there should be a floor to extreme outcomes. The overall measure of unacceptable spread in the income distribution, which we might term unfair inequality, should thus reconcile equality of opportunity andfreedom from poverty. Our recent wok is devoted to this task (Hufe et al. 2018).
Conceptually, we construct the norm distribution of income as follows. We first move all those who are below the poverty line up to the poverty line. This of course raises the question of where the resources come from to achieve this goal. We specify that these are raised through a proportional tax on the surplus of incomes minus poverty line for incomes which exceed the poverty line. This also preserves overall mean income. If we were to stop here the inequality which remains is considered fair or legitimate from the perspective of people who only care about inequalities resulting from some people not having enough to make ends meet. But this may still leave some people disadvantaged relative to others based on factors that they cannot influence in the first place. Hence, in the following we modify the resulting poverty free distribution to satisfy the equality of opportunity ideal. That is, we equalise mean incomes across the circumstance types by proportionate scaling up or down of all incomes exceeding the poverty line depending on their type. Again, this will not change overall mean income.
Given the ideal norm distribution relative to the observed distribution, the next question is on the distance metric between the two. The literature has proposed a number of possibilities (e.g. Magdalou and Nock 2011). We focus here on a family that resembles the generalised entropy class of inequality measures, and in our empirical calculations we highlight a specific member of the family which relates closely to the well-known mean log deviation (MLD) metric. Our measure of unacceptable or unfair inequality is then the distance between the observed distribution and the ideal norm distribution constructed as set out above, using the MLD metric.
We estimate our measures of total inequality and unfair inequality for a cross section of 31 European countries using the 2011 wave of EU-SILC data for individuals aged 25–59 years. We use categories of (i) biological sex, (ii) migration background, (iii) educational status of parents, and (iv) occupational status of parents. The intersection of categories defines 36 circumstance types. For poverty lines, we use 60% of the country-specific median equivalised disposable household income, the European country-specific ‘at risk of poverty’ line.2We also present time series of estimates for the US for 1969–2012, using PSID data for individuals (also for ages 25–59 years) and with the poverty line fixed at 60% of the year-specific median equivalised disposable household income (see Hufe et al. 2018 for full details).
Figure 1 presents total and unfair inequality for 31 European countries. We find that on average 17.6% of total inequality is unfair – that is, that it can be explained by violations of equality of opportunity and freedom from poverty. Unfair inequality is most prevalent in Lithuania, Italy, and Romania, with values of 0.066 (27.9%), 0.063 (31.6%), and 0.060 (29.0%), respectively. From the perspective of our normative stance, income is most fairly distributed in the Netherlands (0.007, 7.0%), Finland (0.011, 9.3%) and Norway (0.011, 12.5%).
Figure 1 Total and unfair inequality for 31 European countries
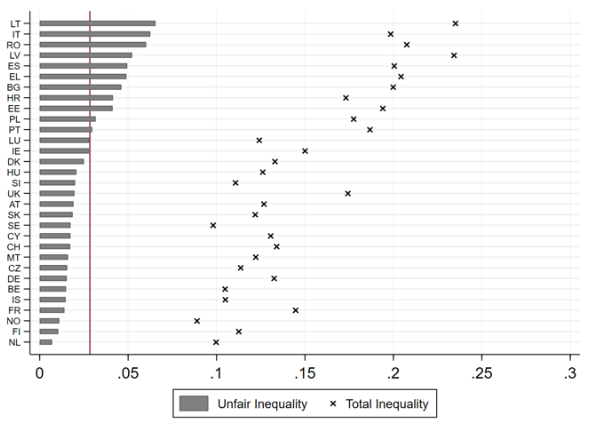
Notes: The gray bars indicate unfair inequality; the black crosses indicate total inequality according to the MLD metric. The vertical red line indicates the unweighted country average in unfair inequality.
Figure 2 illustrates the evolution of unfair inequality in the US over time. The grey line yields our baseline measure of unfair inequality while the black crosses again are indicative of total inequality as measured by the MLD. Starting from a level of 0.023 (16.6%) in 1969, unfair inequality attained a level of 0.130 (32.6%) in 2012. The co-movement of total inequality and unfair inequality shows an interesting pattern. Up until 1980 both total inequality and unfair inequality were relatively stable. The 1980s and early 1990s were characterised by strong increases in inequality from 0.173 in 1980 up to 0.237 in 1995. These increases, however, were only weakly related to violations of either equality of opportunity or freedom from poverty. In this period only 39% of the well-documented rally in inequality levels (Piketty et al. 2018) can be ascribed to increasing unfairness. After 1995, total inequality further increased to 0.398 in 2012. In contrast to the previous period, however, 52% of the increase in inequality can be accounted for by increases in unfairness. Unfair inequality in the US substantially exceeds the corresponding levels of the most unjust European societies (such as Italy and Lithuania) in the last periods of observation.
Figure 2 The evolution of unfair inequality in the US
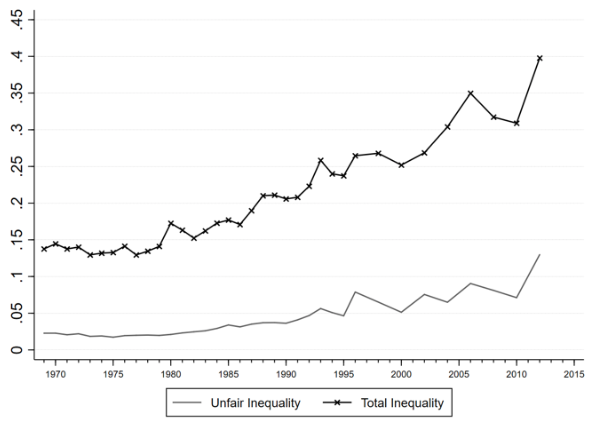
Notes: The grey line indicates unfair inequality; the black crosses indicate total inequality according to the MLD metric.
How much of the unfairness of inequality can be attributed to its two components – equality of opportunity and freedom from poverty? We cannot cleanly allocate all unfair inequality to either freedom from poverty or equality of opportunity, since they are partly overlapping. But we can derive upper and lower bounds (technical details are provided in Hufe et al. 2018). As documented in Figures 3 and 4, our baseline results are driven by equality of opportunity and freedom from poverty in about equal proportions. But, what this does suggest is that relying solely on equality of opportunity as a gauge will grossly understate the degree of unfairness in a society.
Figure 3 Contributions of equality of opportunity and freedom from poverty to unfair inequality for 31 European countries
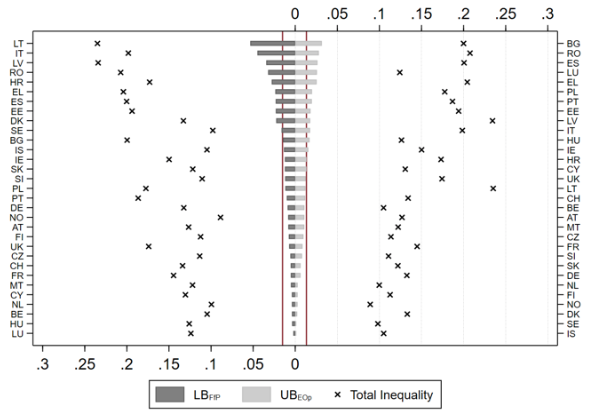
Notes: LB-Lower Bound; UB-Upper Bound. The dark-grey bars indicate unfair inequality due to violations of freedom from poverty; the light-grey bars indicate unfair inequality due to violations of equality of opportunity. The vertical red lines indicate unweighted country averages, respectively. The black crosses indicate total inequality according to the MLD metric.
Figure 4 Contributions of equality of opportunity and freedom from poverty to unfair inequality over time in the US
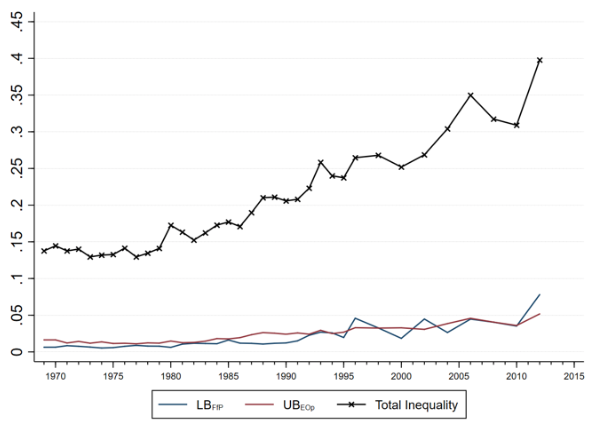
Notes: LB-Lower Bound; UB-Upper Bound. The blue line indicates unfair inequality due to violations of freedom from poverty; the red line indicates unfair inequality due to violations of equality of opportunity. The black crosses indicate total inequality according to the MLD metric.
In our paper, we show that our results are robust to a number of variations, including alternative metrics for distance between observed and norm distributions, alternative poverty thresholds, and alternative norm distributions. One interesting point which emerges is that our unfairness measures are much more sensitive to variations at the bottom of the income distribution than at the top. But our central point still stands. Our new measure of unfair inequality, which reconciles the ideals of equal opportunities and absence of poverty while treating both as co-equal grounds for policy intervention, can provide fundamental insights into the normative structure of income distributions and their evolution.
See original post for references


Wonder who’s the leader in fair inequality?
Dividing total inequality by unfair inequality would indicate Netherlands (about 17). By contrast, Lithuania is about 4. Note that by this measure, UK & France are about equivalent to Finland, which they seem to have done by keeping people out of poverty.
Oops, I was eyeballin’. Article indicates Norway.
====High costs of housing and healthcare lead to a situation where the earnings level needed to be secure is very high.====
Yves and other NC commenters— What drives the high costs in the US? I have tried to do my own research into the high costs of living in the US and have not gotten to the deeper structural causes driving it. If not done so already I would like to see posts on NC that address the sources of the high cost of living in the US. Is it regulations, consolidation of companies in a market/i.e elimination of competition, the FED, or the financialization of our economy? What or who is responsible for the excessively high cost of living and how can it be changed? In healthcare, other governments use price controls on things like drug prices but what other avenues are there to return our society to a more modest and affordable way of living?
My own two cents is the high cost of housing, healthcare, cars/trucks, college, etc. is due to systemic factors that are in place to foster inequality and support a unnecessarily high standard of living. Also too many people in the US are willing to pay exchange value prices for things and do not settle for cheaper alternatives. People are willing to pay $30 -$50K for a new car or truck instead of cheaper and smaller alternatives. The size of most US cars and trucks would make driving in most European cities impossible. Also people who pay $10,000 for a Sleep Number mattress. Due to the high costs of housing in Tokyo many people have small apartments and sleep on futons on the floor and then fold up the futons in the morning to use the bedroom for a living space.
Maybe in 50 years or less when the Fire (fossil fuel) economy runs out of oil then things will change whether people want them to or not and we can go back to a more modest way of living.
One think driving high prices in the USA is the Fed’s QE policy. Real assets become inflated because there is a bunch of money sloshing around looking for a place to invest.
Thanks Lord.
I wonder if your theory of Fed QE policy is one factor in car/truck prices in the US. IMO there is way too many vehicles (i.e. supply), either new or used, than there is demand for them. It’s been decades since Econ 101 but if typically excess supply means prices go down until the point at which demand increases to move the excess supply. But vehicle prices are not going down. I have seen 5 year old used cars and trucks that are still listing for $15,000 and up. So if car companies and banks are not willing to reduce car prices to reduce the excess supply then who is holding the note/value of the car?
This seems to be related to the “economics is a cult” post today. In theory supply and demand. In theory free markets, etc. But that is not the real world that we live in today.
Low lending standards and a high level of immigration are used to keep the demand for cars and housing high. This also strains the infrastructure and services and lifts their prices.
In order to keep turning, the hamster wheel needs lots of public money to help the low income borrowers pay their debts. Don’t forget forgiveness… of debt, in case of bankruptcy.
The productive taxpayers who are forced to finance this little game find themselves paying both high taxes and high prices.
Is this fair? A fun question indeed.
Is it naked? Certainly, but it’s not capitalism.
Jerry, one way to examine your question might include my “burning bush” metaphor. Just characterize regional centers that generate income & wealth (I&W) as burning bushes.
– The bigger the burning bush; the greater the productivity of enterprises.
– The greater the productivity of enterprises; the greater the attraction to I&W.
– However, proximity to the heat of the bush increases exposure to getting burned.
Thus you have productivity, income, and risk all emanating from the metaphorical burning bush. Those three factors associate an income attraction value (IAV) with proximity to the burning bush which is expressed as cost of living (COL). As I&W increases, it enables increased proximity because one can afford a higher COL. However, proximity also increases risk due to loss of income – being burned – as unemployment drains wealth in proportion to COL.
As wealth increases; the IAV associated with bush proximity decreases (i.e., there is less need to be near burning bushes and less need for exposure to getting burned). This explains why people with wealth often elect to move vertically or horizontally away from the heat of the burning bush, whereas people dependent on the bush for income continue to move closer to it. My commonsensical burning bush metaphor explains geographic diversity in I&W as well as explaining why some regions such as NYC and Silicone Valley have higher COLs than Paw Paw, MI. It is all relative to the heat generated by regional burning bushes.
Thanks Tom. I like your burning bush model but I do not think it applies evenly to all aspects of Cost of Living. For instance it does not apply to vehicle prices, healthcare costs, college tuition, and others. It can be used to explain why as you say the cost of living in Silicon Valley is higher than Paw Paw, MI. But in those cases the burning bush idea mostly applies to housing. Because demand for housing in those areas is high then housing prices are high. Then one could use your income attraction value (IAV) to explain higher costs for other essentials in the in demand areas like NYC.
One caveat. My wife and I were looking at places to move when we retire and being fond of cooler weather than hot we have been looking to move further north than the Chicago area where we currently live. We looked into small towns around Duluth, MN and Madison, Wi. Even OUTSIDE those small cities housing costs are still high.
Again I like your burning bush model for some explanation of higher prices especially for in demand cities such as the coastal cities, but I believe there are other factors at play that are driving healthcare, car prices, college costs, and other essentials.
Jerry,
I think an argument could be made that even the services and commodities you mentioned still correlate significantly with economic reality in a burning bush model.
We retired from very-high-cost Bethesda to coastal Florida east of Orlando. We moved from our mortgaged, very-nice 4BR custom house into a newer, 40%-bigger, storm-resistant house a 5-Iron from the ocean’s edge. We put in a commercial-sized pool yet still had no need for a mortgage due to profits from our burning-bush house. We have a lawn service because labor is cheap here. The Gulf Stream keeps us cooler in summer and warmer in winter. Electric is 35% lower here, as is water and waste. Taxes are less than half what we paid in Maryland.
Commodity costs are indeed lower away from the burning bush. Our Cadillac was cheaper because of the lower COL. There are fewer people competing for luxury cars. State University tuition is much less costly here than in Maryland. Groceries are cheaper because Florida is a meat and produce exporter to other states. Healthcare is less costly here because more physicians accept Medicare and join HMOs. Highways are the best in the USA thanks in part to tourism taxes. In fact, the only thing that costs more than Maryland is house insurance, which is twice as costly because we do get hurricanes every year. No region is perfect. :-)
Thus, I think a case can be made that nearly everything costs less when not too close to a burning-bush city. I admit to being surprised at my experience. Honestly, moving away from DC not only closed the gap between work income and wealth income; our net income actually rose 10K. Of course, mine is an N=1 model test. It needs regional replication.
====Thus, I think a case can be made that nearly everything costs less when not too close to a burning-bush city====
Over the course of my life I have frequently facilitated a number of groups in both a professional capacity and in my personal interests. One observation I have noticed is that sometimes groups will get off track when two men get into positional or territorial arguments (i.e. conservative-liberal, Ford vs Chevy, Climate Change, etc.). Positional arguments tend to be impossible to get agreement on as both people tend to root themselves into their respective positions.
It appears that is where our debate is headed. I respect your view that you believe your “burning bush model” explains everything as far as cost of living issues in the US. However I respectfully and completely disagree.
I have always looked at any issue as nuanced and “it depends”. The psychologist Jerome Kagan wrote a book called Human Nature where he views things similarly. His view of human nature is: it depends, under what context, what time period, what part of the world, what circumstances, cultural issues, etc. etc.
Thanks for sharing your burning bush metaphor/theory. I find it interesting.
Henry George blamed rent.
Has his thesis been falsified?
Good segue from yesterday’s globalization and inequality post. The almost vertical rise of unfair inequality since 2010 in fig 2 rings true. That jump illustrates something so out of whack that Trump won the Oval office.
As policy guides, opportunity and freedom from poverty are a good start; however, how will the the neoliberal corporate system, the shadow elites who game it and the plutocrats be brought to the table?
Also, regarding opportunity. How much of freedom of opportunity is constrained by shadow-elite type architectures: privitization of information, bending of rules, unaccountability, loyalty to one’s faction. If information is the resource of our time, the control and manipulation of it constrains opportunity in ways that are harder to identify as well as overcome as an individual. BTW, libertarians seem to object more coherently than leaft-leaners to this realignment affecting individuals being free to achieve/seize opportunity.
Consider the “distinction between ‘circumstance’ and ‘effort’ as determinants of income” for beginning these calculations of ethically acceptable distribution of income.
If you have two fellows digging ditches in the same dirt it seems relatively straightforward to guage their level of effort — as long as you ignore that a little guy might have to put a lot more effort into moving the same amount of dirt as the big guy. Makers of widgets might be compared based on the number widgets they turn but the number of widgets doesn’t fully account for the ‘effort’ involved. How do you compare the effort of a ditch digger to the effort of the accountants tracking his digging? How do you compare the effort of the CEO to the effort of the ditch digger? What about nasty jobs like collecting bed-pans or gutting chickens or pigs?
I have qualms about this approach to the problem of calculating of an ethically acceptable distribution of income even before I get to constructing a distance metric using “a family that resembles the generalized entropy class of inequality measures.” And if “The methods [to derive measures of unfair inequality across countries] are relatively easy to implement, which perhaps explains why there is now a veritable mini-industry doing such calculations …” — why construct yet another one?
This post covers a topic that I believe properly belongs to philosophy and it attempts to dress a preferred answer with mathematics in place of a foundation built from the kind of reasoned arguments that serve philosophy. Distance metrics and generalized inequality measures and similar tools used for purposes like this post can too easily be bent and reshaped to support a contrary conclusion. “The intersection of categories defines 36 circumstance types.” — which seems ample space for some contrary adjustments to reshape the answer. It doesn’t take so much as the back of an envelope to conclude that there’s something very rotten about the US economy and neither this post’s reasoning and math nor the back of an envelope get very far toward fully characterizing that rot.
I do think that the share of unfair inequality of overall inequality is *higher* than this paper indicates. They are approaching the subject from mid 20th century capitalist perspective. (Corrupt) realignments of power structures, failures of institutions and dwindling resources are also drivers now. At least it is a start.
The charts of rising inequality in the U.S. reflected in Figures 2 and 4 are parabolic, which as with asset prices can be indicative of an emerging bubble. IMO the charts reflect the reality that a relatively few individuals in the U.S. have engineered a massive transfer of wealth to themselves over the past three decades, as their business activities and financial losses stemming from their own actions have repeatedly not only been heavily subsidized or made whole by government policies, but they have over time enjoyed very high rates of financial return at considerable cost to others, often under the very definition of an illegitimate or unfair process.
The doors to peacefully changing the status quo in the U.S. have also largely been shut over this time period. Whether change ultimately comes from internal agents or outside factors, let’s hope some wiser minds prevail to reopen those doors to a legitimate desire for change.
===High costs of housing and healthcare lead to a situation where the earnings level needed to be secure is very high===
Another point related to this is the high earnings required to afford the high costs of living dominoes into other areas such as the public sector.
One example is cities and towns that need cars and trucks for streets and sanitation functions and for other departments probably pay close to the same high prices that we do. And those higher costs for things such as public works trucks get passed on to taxpayers in the form of property taxes and other taxes.
Another example is healthcare professionals such as nurses that live in high cost of living areas need higher earnings to afford to live. The high earnings for healthcare professionals due to high costs of living get passed on in the form of high healthcare costs.
Where does this end?? I am exaggerating for effect but…..$100,000 for a Chevy?? $1,000,000 for a very modest house?? $1,000 for aspirin at a hospital??? This cost/price escalation cannot continue and when the bubbles burst and a crash comes it might make the Great Depression look like a walk in the park.
If a person that was an adult (30 years old) during the Great Depression were to time travel to today they probably would faint from the absurd prices for just being able to as Yves said above “be secure”.
Lastly I have mentioned in other posts that I watched a documentary called Tomorrow about the environment, democracy, and the economy. There was a comment in the film, “Why do we need a 3000 lb vehicle to transport someone that weighs 150lbs???” I see many people driving alone in large SUVS and big pickup trucks. It is absurd.
Why is it the problem of any of ours to fix? Meddling with Darwinism is a fools errand, and besides, having a Bezos or Gates to aspire towards is what keeps so many of us in the game. Wipe that out and your just as broke/rich as your neighbor… where’s the dreaming in that? Yves, have you gone full left or is it I that has drifted right over the last ten years? Anyways, thanks for such yeoman’s work.
I am middle of the road Reagan era. The US has moved right. Societies that are more equal are not only happier, but are healthier even for the rich. Lifespans of the wealthy suffer in highly unequal societies relative to those of more equal ones.
If you think calling me a leftie is going to cow me, you are smoking something very strong.
Your claim that extreme inequality is a natural result is laughable. Income distribution is the result of many social choices. The wealthy benefit enormously from subsidies. Amazon would not have had a business had it not been allowed to evade retail sales taxes. Its warehouse workers often need subsidies to live, in the form of food stamps and Medicaid.
And I don’t buy for a minute the claim that Gates or Bezos are essential or valuable. You seem to forget that Gates’ didn’t develop the Microsoft OS, and his huge break of licensing it to IBM came via family connections (his mother sitting on the board of a not-for-profit with a key Microsoft exec). He has been a fabulously and famously ruthless businessman. Is that estimable or socially valuable? MS software sucks, but you can get away with that with a dominant position. WordPerfect circa 1994 and Lotus’ Improv (another 1990s product) is vastly superior to Word and Excel today.
The US had a higher growth rate when the income distribution was less skewed and we had enforcement of antitrust. If Judge Penfield Jackson hadn’t blown it and given a press interview, he would have presided over the remedies phase of the Microsoft antitrust trial, as opposed to his replacement, the cautious and dim-by-Federal-judge standards Coleen Kollar-Kotelly. Jackson would probably have broken up Microsoft into an OS company and an “other apps” company.
Frankly I think the world would have been vastly better off if Digital Research had remained the dominant OS player in the desktop space–Kildall wasn’t even 1/10th as megalomaniacal or paranoid as Gates, and had no ambitions to corner the market in application software.
And GEM was leagues ahead of Windows for as long at as it was a going concern. (Interesting comment to the linked video regarding the Carlyle Group’s hand in ensuring eventual Microsoft’s victory over DR.)
I am probably pretty right of center and capitalist in my views compared to many on this website but I would also agree that the economy of USA (and other countries) has gone off the rails. And I strongly agree with your assertion that Gates and Bezos are not essential or valuable. Over the years I have watched them, many times, kill off better or superior products and technologies simply by using their monopoly powers.
In the end, one has to decide whether capitalism is a servant of humanity or humanity is a servant to capitalism. Whereas capitalism should rightly be wrapped by progress, aspiration, opportunity and reward there must be limits, in my view.
I recently returned from a destination where hundreds of private boats were docked and asked about the mooring fees for the dozen or so larger pleasure yachts (that looked as if no one was on board, by the way). I was told that they were about 1 million Euros per week. When one considers the problems that this world faces today, this is simply obscene.
Not quite as obscene as your example but I sent this to Lambert and he posted it on Links today.
https://www.dailyherald.com/business/20180930/vehicle-subscription-becomes-reality-at-naperville-dealership
Instead, with a monthly payment of $1,495 after a $500 activation fee, members will have access to three “flips” a month, each giving them use of a new vehicle from a list of luxury rides including Audis, BMWs, Land Rovers, Mercedes-Benzes and Porsches.
$1,500 a month to have access to a buffet of luxury cars??? Clearly, many people have way to much disposable income.
Yves,
“MS software sucks, but you can get away with that with a dominant position. WordPerfect circa 1994 and Lotus’ Improv (another 1990s product) is vastly superior to Word and Excel today. ”
Thank you so much for saying that…… I was maybe the last person on earth to stop using lotus 123…
When MS Win 7 would’nt run it…. Having switched to Excel for a few years…I still think it’s bad software..
I just thought I was an old guy who couldn’t adapt…..
Regarding the OP…… My observation is prices started to really increase when they started selling the monthly payment rather than the price… and secondly when it became “smart” to not pay off mortgage but “invest” because you could earn more….
Anecdote: I had a friend (Ivy League Graduate) who had received a large bonus and wanted to buy a boat for cash with the money. I suggested he finance the boat and paydown his house with the extra $$.
He asked why would he do that. I responded, because if things go bad, give the boat keys to the bank and you still have the house.
He went with his original plan…