By Wolf Richter, a San Francisco based executive, entrepreneur, start up specialist, and author, with extensive international work experience. Originally published at Wolf Street.
In San Francisco, the most expensive of the 100 largest rental markets in the US, rents peaked in October 2015, with the median asking rent at $3,670 for a 1-bedroom apartment and $5,000 for a 2-bedroom. By the end of 2017, they were down 7% and 12% from their peaks. But in the spring 2018, rents started rising again. In September, they almost, but not quite, reclaimed their peaks: The median asking rent for 1-BR apartments rose to $3,650, and for 2-BR apartments to $4,800. These are crazy numbers. Hence our local term, “Housing Crisis” – a crisis of affordability in a hyper-inflated market.
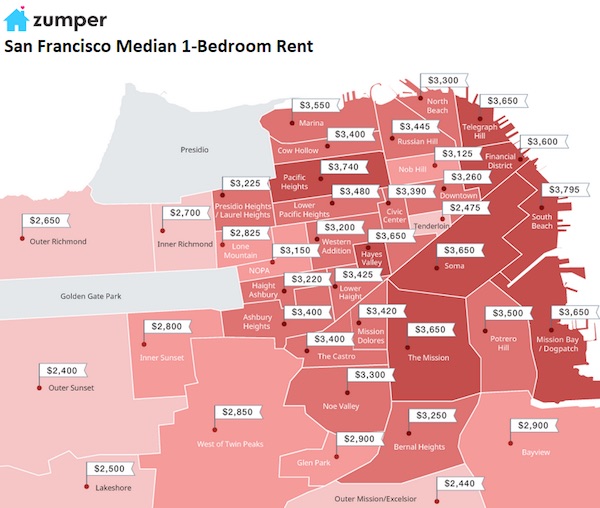
There are differences from neighborhood to neighborhood, ranging from $2,400 in Outer Sunset (in San Francisco, housing gets cheaper the closer it is to the ocean due to the incoming fog) to $3,740 in Pacific Heights. The map below by Zumper shows the median asking rents by neighborhood. Single-family houses are concentrated in the left two-thirds of the map. Multi-family buildings – hence, much of the rent data – are concentrated in the right third of the map. These rents do not include the latest increases:
These are median asking rents. “Median” means half of the apartments rent for more, and half for less. “Asking rent” is the amount the landlord advertises in the listing. The apartments are in multifamily buildings, including new construction. Single-family houses for rent are not included. Rooms, efficiency apartments, and apartments with three bedrooms or more are not included. Zumper collects this data from over 1 million active listings of apartments-for-rent in the 100 largest markets. This includes 3rd party listings received from Multiple Listings Service (MLS). Zumper releases this data monthly in its National Rent Report.
In New York City, the second most expensive rental market, median asking rents rose 1.8% for a 1-BR ($2,850) and 5.8% for a 2-BR ($3,280). But these rents are down from their peak in March 2016 by 15% and 17% respectively!
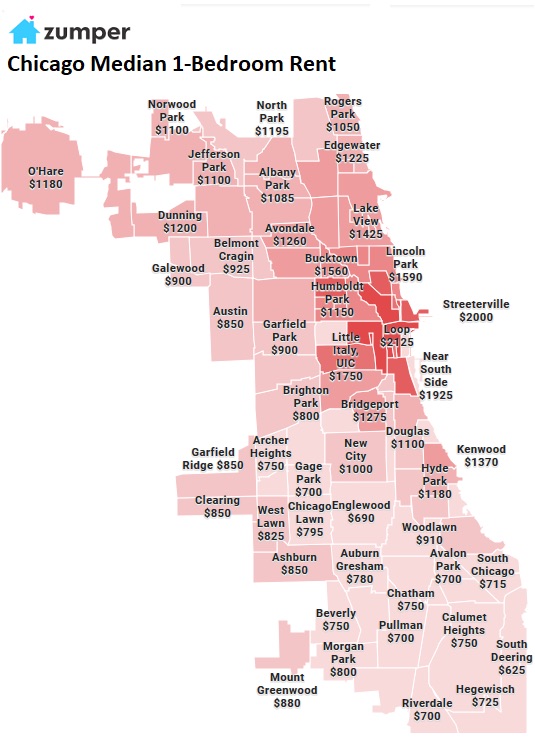
In Chicago, rents have plunged since late 2015: By September, the 1-BR asking rent, at $1,510, was down 26% from its peak and the 2-BR rent nearly 30%!
Part of the reason is a multi-year decline in population coinciding with new construction. In the Chicago-Naperville-Elgin metro area, with 9.5 million people, 10,700 apartments are scheduled to be delivered in 2018. But since 2014, the population has dropped by 27,000 people.
In terms of rent, there are large variations by neighborhood, with the median asking for a 1-BR rent ranging from $625 in South Deering to $2,125 in the Loop (map via Zumper):
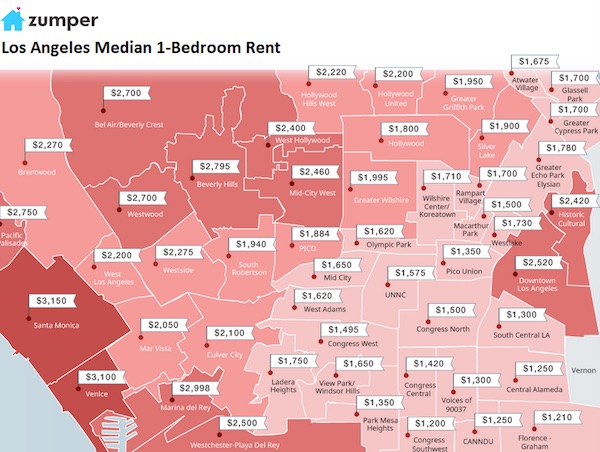
Southern California is in a full-blown rental boom: In the Los Angeles metro, the third/fourth most expensive market in the US, 1-BR rents jumped 9.7% year-over-year to a record $2,470, and 2-BR rents rose 1.3% to $3,310, down by smidgen from the record in June.
By area, 1-BR asking rents range from $1,200 in Congress Southwest to $3,150 in Santa Monica:
To stay in Southern California for a moment: in San Diego, the median asking rent for 1-BR apartments in September jumped 11.5% year-over-year to $1,840; and for 2-BR apartments, 8.7% to $2,500.
In Long Beach, 1-BR rents jumped by 14.6% to $1,570 and 2-BR rents by 7% to $2,000, both down a tad from the records earlier this year.
In Santa Ana, our sample for Orange County, 1-BR rents rose 6.3% to a record $1,920 a new record, and 2-BR rents edged to a record $2,250.
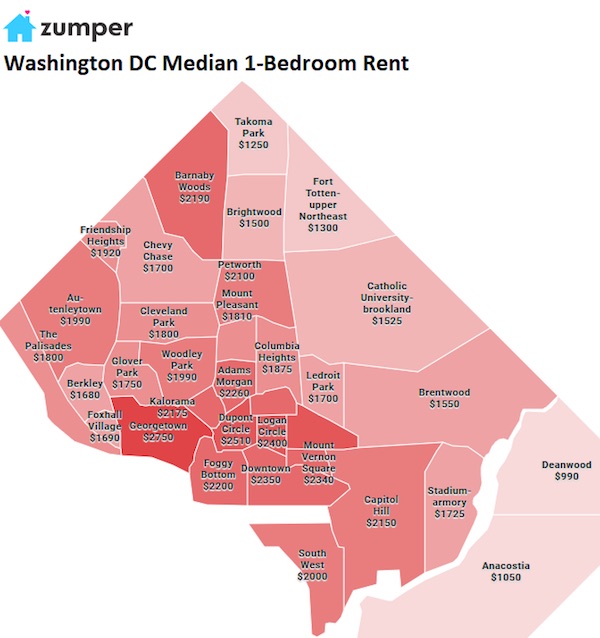
Washington DC rents are now under pressure: 1-BR rents in September dropped 4.4% year-over-year to $2,160 and are down 7.7% from their peak in December 2017. And 2-BR rents plunged nearly 14.8% year-over-year to $2,710 and 17.6% form the peak in June a year ago.
By neighborhood, median asking rent for a 1-BR ranges from $990 in Deanwood to $2,750 in George Town:
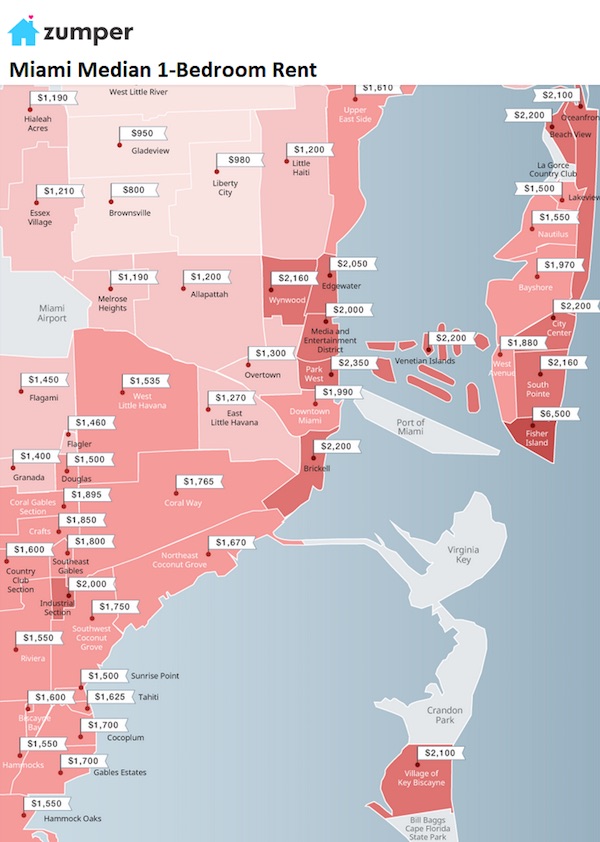
In Miami, the median asking rent for 1-BR apartments, at $1,800, was flat compared to a year ago and down $100 from the peak in June 2016. For 2-BR apartments, it edged down year-over-year to $2,430 and was down 8% from the peak in March 2016. By neighborhood, 1-BR median rents range from $800 in Pinewood Part and Brownsville to the distant outlier of $6,500 in Fisher Island:
Honolulu rents are still spiraling down. The median asking rent for 1-BR apartment, at $1,680, has plunged 21% from the peak in March 2015. The 2-BR rent, at $2,200, has plunged 25% from the peak in January 2015.
The table below shows the 17 of the 100 most expensive major rental markets in the US. The shaded area reflects peak rents and the movements since then. The black “0%” in the shaded area means that these markets set new records in September. If rents are down slightly from the peak a few months ago, it doesn’t yet mean that the market has turned – that would require a more significant decline in rents spread beyond seasonality.
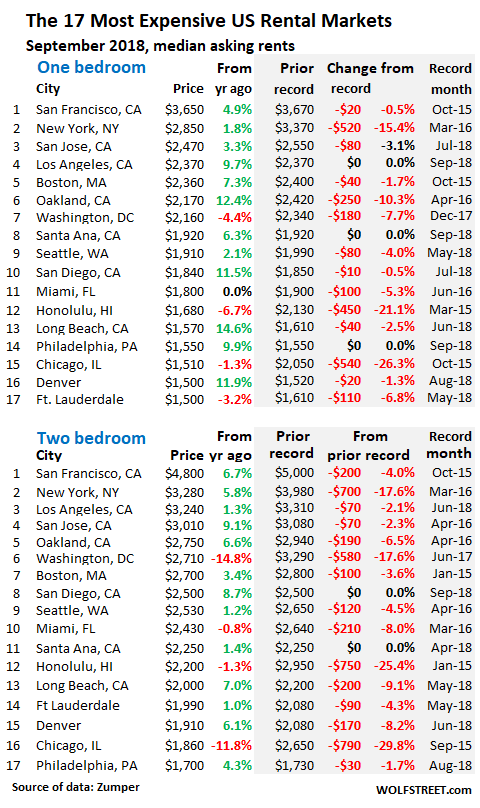
Note the new entrant on the list: Philadelphia. I removed Anaheim, in Orange County, CA, because Santa Ana, also in Orange County, tracks it closely.
The Seattle metro is in the middle of a construction boom. Over the five years through 2018 so far, over 46,000 apartment units in buildings with over 50 apartments have been constructed. This does not include construction of condos, apartments in smaller buildings, or single-family homes. This is nearly four times the number of units built in 2004-2008. An additional 24,000 apartments in large buildings are under construction and 40,000 are further up in the pipeline [here’s my discussion of this situation… Seattle’s Rental Bubble Meets its Inflection Point].
This flood of supply has had a dampening effect on Seattle’s rents. The median 1-BR rent, at $1,910, is down 4% from the peak in June 2018, and the median 2-BR rent, at $2,530, is down 4.5% from April 2016.
Many Smaller Markets Are Red-Hot.
Across the US, the median asking rent in September for 1-BR apartments rose 1.6% from a year ago, to $1,211. For 2-BR apartments, it rose 3.0% to $1,443. But national numbers average away the often-double-digit drama, up and down, in individual markets.
Numerous markets in the US have experienced double-digit year-over-year rent increases – including 12 cities of the 100 most expensive where these increases either for 1-BR or 2-BR apartments reached or exceeded 16%!
In the lower half of the table below of the 100 most expensive rental markets, year-over-year rent increases of 12% or more are fairly common. When people say that their rent increases were much higher than the increases in the Consumer Price Index for rent, that’s why. Exorbitant rent increases are real, but not in all markets.
Entries are in order of median asking rent for 1-BR apartments in September and show percentage changes from a year ago (data by Zumper; use the browser’s search function to find a city):
| 1 BR | 2 BR | ||||
| Pos. | City | Rent | Y/Y % change | Price | Y/Y % change |
| 1 | San Francisco, CA | $3,650 | 4.90% | $4,800 | 6.70% |
| 2 | New York, NY | $2,850 | 1.80% | $3,280 | 5.80% |
| 3 | San Jose, CA | $2,470 | 3.30% | $3,010 | 9.10% |
| 4 | Los Angeles, CA | $2,370 | 9.70% | $3,240 | 1.30% |
| 5 | Boston, MA | $2,360 | 7.30% | $2,700 | 3.40% |
| 6 | Oakland, CA | $2,170 | 12.40% | $2,750 | 6.60% |
| 7 | Washington, DC | $2,160 | -4.40% | $2,710 | -14.80% |
| 8 | Santa Ana, CA | $1,920 | -6.30% | $2,250 | 1.40% |
| 9 | Seattle, WA | $1,910 | 2.10% | $2,530 | 1.20% |
| 10 | San Diego, CA | $1,840 | 11.50% | $2,500 | 8.70% |
| 11 | Miami, FL | $1,800 | 0.00% | $2,430 | -0.80% |
| 12 | Anaheim, CA | $1,710 | 7.50% | $2,120 | 6.00% |
| 13 | Honolulu, HI | $1,680 | -6.70% | $2,200 | -1.30% |
| 14 | Long Beach, CA | $1,570 | 14.60% | $2,000 | 7.00% |
| 15 | Philadelphia, PA | $1,550 | 9.90% | $1,700 | 4.30% |
| 16 | Chicago, IL | $1,510 | -1.30% | $1,860 | -11.80% |
| 17 | Denver, CO | $1,500 | 11.90% | $1,910 | 6.10% |
| 17 | Fort Lauderdale, FL | $1,500 | -3.20% | $1,990 | 1.00% |
| 19 | Atlanta, GA | $1,460 | 7.40% | $1,810 | 6.50% |
| 20 | Minneapolis, MN | $1,440 | 16.10% | $1,980 | 8.80% |
| 21 | Providence, RI | $1,410 | -6.00% | $1,560 | 1.30% |
| 22 | Portland, OR | $1,400 | 2.90% | $1,660 | 3.80% |
| 23 | Baltimore, MD | $1,380 | 12.20% | $1,650 | 15.40% |
| 24 | New Orleans, LA | $1,370 | 9.60% | $1,490 | -0.70% |
| 25 | Nashville, TN | $1,350 | 15.40% | $1,390 | 3.70% |
| 26 | Madison, WI | $1,300 | 9.20% | $1,480 | 13.80% |
| 27 | Sacramento, CA | $1,280 | 14.30% | $1,410 | 5.20% |
| 27 | Scottsdale, AZ | $1,280 | 5.80% | $1,970 | -9.20% |
| 29 | Dallas, TX | $1,270 | -8.00% | $1,710 | -6.00% |
| 30 | Houston, TX | $1,260 | 9.60% | $1,570 | 9.00% |
| 30 | Orlando, FL | $1,260 | 13.50% | $1,460 | 15.00% |
| 32 | Austin, TX | $1,230 | 12.80% | $1,500 | 7.90% |
| 33 | Newark, NJ | $1,180 | 14.60% | $1,410 | 12.80% |
| 34 | Aurora, CO | $1,150 | 15.00% | $1,450 | 6.60% |
| 34 | Charlotte, NC | $1,150 | 1.80% | $1,290 | 4.00% |
| 34 | Pittsburgh, PA | $1,150 | -10.90% | $1,350 | -3.60% |
| 37 | Durham, NC | $1,140 | 15.20% | $1,250 | 13.60% |
| 37 | Irving, TX | $1,140 | -1.70% | $1,420 | 1.40% |
| 37 | Plano, TX | $1,140 | 1.80% | $1,510 | 0.70% |
| 40 | Tampa, FL | $1,130 | 7.60% | $1,340 | 5.50% |
| 41 | Gilbert, AZ | $1,110 | 11.00% | $1,330 | 0.80% |
| 42 | Chandler, AZ | $1,100 | 12.20% | $1,310 | 6.50% |
| 43 | Fort Worth, TX | $1,070 | 15.10% | $1,280 | 10.30% |
| 43 | Henderson, NV | $1,070 | 12.60% | $1,260 | 12.50% |
| 43 | Richmond, VA | $1,070 | 7.00% | $1,230 | 5.10% |
| 46 | St Petersburg, FL | $1,050 | 15.40% | $1,520 | 16.90% |
| 47 | Chesapeake, VA | $1,040 | 15.60% | $1,200 | 0.00% |
| 47 | Salt Lake City, UT | $1,040 | 15.60% | $1,380 | 14.00% |
| 49 | Buffalo, NY | $1,030 | 13.20% | $1,350 | 13.40% |
| 50 | Virginia Beach, VA | $1,020 | 2.00% | $1,200 | 0.00% |
| 51 | Raleigh, NC | $1,000 | 3.10% | $1,160 | 6.40% |
| 52 | Milwaukee, WI | $970 | 15.50% | $1,110 | 16.80% |
| 53 | Fresno, CA | $960 | 15.70% | $1,090 | 16.00% |
| 53 | Jacksonville, FL | $960 | 6.70% | $1,090 | 3.80% |
| 55 | Phoenix, AZ | $950 | 11.80% | $1,190 | 12.30% |
| 56 | Kansas City, MO | $940 | 13.30% | $1,060 | 5.00% |
| 57 | Boise, ID | $920 | 16.50% | $1,030 | 14.40% |
| 57 | Las Vegas, NV | $920 | 15.00% | $1,120 | 14.30% |
| 57 | San Antonio, TX | $920 | 10.80% | $1,150 | 12.70% |
| 60 | Colorado Springs, CO | $910 | 13.80% | $1,100 | 4.80% |
| 61 | Anchorage, AK | $900 | -1.10% | $1,150 | 4.50% |
| 62 | Corpus Christi, TX | $870 | 6.10% | $1,070 | 5.90% |
| 63 | Mesa, AZ | $860 | 7.50% | $1,020 | 8.50% |
| 64 | Reno, NV | $850 | 14.90% | $1,200 | 15.40% |
| 65 | Louisville, KY | $840 | -2.30% | $1,020 | 9.70% |
| 66 | Baton Rouge, LA | $830 | 3.80% | $950 | 11.80% |
| 66 | Des Moines, IA | $830 | 10.70% | $900 | 9.80% |
| 66 | Laredo, TX | $830 | 15.30% | $990 | 16.50% |
| 66 | Omaha, NE | $830 | 2.50% | $1,090 | 9.00% |
| 70 | Rochester, NY | $820 | 15.50% | $1,010 | 16.10% |
| 70 | Syracuse, NY | $820 | -5.70% | $1,010 | 12.20% |
| 72 | Arlington, TX | $810 | 15.70% | $1,080 | 16.10% |
| 72 | Knoxville, TN | $810 | 15.70% | $930 | 16.30% |
| 72 | Norfolk, VA | $810 | 14.10% | $940 | 4.40% |
| 75 | Cleveland, OH | $790 | 16.20% | $870 | 14.50% |
| 76 | Chattanooga, TN | $780 | 16.40% | $850 | 13.30% |
| 76 | Cincinnati, OH | $780 | 14.70% | $1,130 | 14.10% |
| 76 | Winston Salem, NC | $780 | 14.70% | $880 | 15.80% |
| 79 | Columbus, OH | $770 | 6.90% | $1,070 | 16.30% |
| 79 | Glendale, AZ | $770 | 14.90% | $950 | 5.60% |
| 81 | Lexington, KY | $760 | 1.30% | $920 | 1.10% |
| 81 | St Louis, MO | $760 | 15.20% | $1,090 | 14.70% |
| 83 | Augusta, GA | $750 | 15.40% | $830 | 3.80% |
| 83 | Bakersfield, CA | $750 | 8.70% | $860 | 1.20% |
| 85 | Memphis, TN | $730 | 10.60% | $790 | 11.30% |
| 85 | Tallahassee, FL | $730 | 15.90% | $870 | 8.70% |
| 87 | Greensboro, NC | $720 | 12.50% | $830 | 3.80% |
| 87 | Oklahoma City, OK | $720 | 14.30% | $870 | 11.50% |
| 89 | Spokane, WA | $710 | 4.40% | $900 | 4.70% |
| 90 | Lincoln, NE | $700 | 14.80% | $960 | 14.30% |
| 91 | Albuquerque, NM | $670 | 3.10% | $840 | 1.20% |
| 92 | Indianapolis, IN | $660 | 15.80% | $800 | 14.30% |
| 93 | El Paso, TX | $640 | 3.20% | $750 | 1.40% |
| 93 | Shreveport, LA | $640 | 14.30% | $720 | 10.80% |
| 95 | Tucson, AZ | $630 | 0.00% | $850 | 2.40% |
| 95 | Tulsa, OK | $630 | 6.80% | $800 | 11.10% |
| 97 | Lubbock, TX | $620 | 12.70% | $770 | 5.50% |
| 98 | Wichita, KS | $610 | 15.10% | $740 | 13.80% |
| 99 | Detroit, MI | $600 | 9.10% | $700 | 7.70% |
| 100 | Akron, OH | $550 | 3.80% | $700 | 7.70% |


My family has small rental property business, 7 houses, in a 25,000 person town in middle Tennessee, halfway between Nashville and Chattanooga. Recently, an investor from California has been buying up the market. Prices are a little off peak from a few months ago. Not sure if this is a corporate investor or someone with family connections to area, but it is being noticed by the locals.
Thank you for this expansive article. Well done!
Nice to have confirmed I am renting my condo in Chicago below market. I didn’t relocate for $$ and I ain’t no professional landlord.
anecdotally, lots of institutional money has moved into my suburban region. Buying up old-style resort rental complexes built post-WWII, buy which have over the years have slipped down the desirability ladder and become affordable housing for the bottom half of the income range.
But instead of trying to stay affordable, the new (presumably distant) owners are gentrifying the complexes, remodeling interiors, etc. But by doing (in my opinion) they’re chasing an imaginary market—all the luxury apartments are most desirable in the suburban downtowns, not these resort properties.
I doubt these REITs will make as much as they think they will—-unless they flip the properties to another gullible institution.
I wish this was useful for individual level decision making. But at least for Boston, it’s misleading. For most rentals outside of new luxury condos, there’s a broker fee equal to 1 month’s rent. So a $2,000/mo unit is actually $26,000 a year. Plus, does the Boston data include Somerville? I pay substantially less than the median price, live in a nice area, and have easy access to mass transit. (I’m maybe 20 minutes on the T from Boston.) But looking at the aggregate data, I’d be skeptical of moving to Boston were I not already here. So it is similarly dissuading when looking at NYC, SF, or Seattle, despite this being where the jobs are in my field. Sigh.
Oh yes, the damn broker fee in Boston. Some things don’t change, I guess.
They are thankfully rare around here but they do exist. A representative for a rental industry body argued against an attempt to ban them, on the grounds that they offer a valuable service for renters with the means to pay by expanding their pool of available rentals and reducing the competition. Thankfully the neoliberal brainwashing is less pervasive here and he received a round of well-deserved vilification for it.
My recollection is that the days of Somerville being a cheap and attractive alternative to Cambridge were already long gone 15-20 years ago, and you had to go to Medford or Arlington to get something affordable. I loved the neighborhood though – I always thought it was underrated. Lots of culture and diversity, and a nice contrast to Wellesley where I lived earlier (uniformly white upper-middle class suburban reactionary, with weekly mailings for gay re-education camps and the like).
It’s accurate for San Antonio. Residential real estate haz been hot hot hot for the last 3 years at least. Rising property values mean I am at the appraisal office every year protesting my residence and rental houses double digit increases (property tax in Texas is about 3% of value). Every week i get letters from instutional and individuals offering to buy my properties for cash.
Fascinating! As a homeowner in the Chicago suburbs I can attest that the market is soft, soft, soft for all but hottest micromarkets. Millennials are very keen to move where their peers are going. So far they hate the suburbs, but Rahm Emanuel’s skyrocketing taxes are giving them pause, while his decision to vacate City Hall makes them nervous over what is to come. He convinced them that he would fix the schools and do whatever it took to keep the middle class and their jobs and perks in the city. Now he won’t be there. Anxiety is palpable.
As a market (the entire metro area) we NEVER recovered from the crash. Now the state and city budget crises are too blatant to ignore. If Pritzker wins the governorship (likely) taxes will rise sharply and all hell will break loose as people run for the exits. It is the moment in the horror movie when the smart people know the monster is on the loose but fears it is too late to prevent mass carnage. I see no way out.
Chicago’s taxes pale in comparison to the places in San Francisco millennials are moving to. The income tax is almost double and the sales tax is just as high not to mention the rent that is triple. The schools are also shit and I’m pretty sure SF has Chicago beat on rampant homelessness although crime levels are probably better as no one can afford to be a thief in SF as it doesn’t pay enough to make the rent.
Both sf and Chicago have become unaffordable for the majority of the people who don’t come from money and who lack parents who can front the rent for their kids. You have to be really bad at math to move to either place.
And here in good ole Tucson, there’s a veritable forest of “for rent” signs. It’s been this way for years.
Here’s the big issue – notice the amount of green in that list.
How many people’s wages have jumped by that much? Hint: Corporate America these days only grudgingly gives out a measly 2% increase that keeps up with the official inflation rate, which far understates the real rate considering most of the numbers there are higher than 2%.
Rent for many is their largest expense. That’s why most people are falling behind and that’s why we have many of our current problems.
Ding, ding, ding! Would someone please tell me how a person who makes $12-$15 an hour can afford a one-bedroom apartment for $1,400 a month?
Exactly what I’ve been wondering. Here in Island County, WA, the median resell price (not rental, but still) is up $92,000 in just 3 years. Who get’s 30K/year raises, for 3 straight years?
https://www.seattletimes.com/seattle-news/politics/its-not-just-a-seattle-thing-candidates-for-legislature-try-to-woo-voters-with-plans-to-ease-housing-costs/
Meanwhile, it’s still legal to demand 110% of employees while not paying them enough to shelter and feed themselves. Even if it were at $15/h, that’s still over $3/h less than the area housing wage.
I’m going to likely catch hell for this, but why do people earning minimum wage live in an area they can’t afford to live? I had a chance to move to San Diego in 1994, but I couldn’t afford the rent so I chose to live in a lower cost City.
My experience is that the financial illiteracy in this country can’t be overstated.
Seattle and Island County didn’t use to be the expensive place it has become, thanks to Amazon! Many long-term residents are moving away, as did I. So, Seattle has priced out the people who made the city a nice community, replaced by large-salaried Amazon techies. The entire flavor of Seattle, its heart, has gone.
A lot of people are just staying where they are from, but it’s nice that connections to other human beings are now framed as financial illiteracy, and so the spin continues. The current economic system values human connections about as much as it values human beings = not at all.
Does nobody read “Progress and Poverty” anymore?
I have on my to read list. Does that count?
:-)
More seriously, I think it’s been mentioned more than once on NC.
I counted nine cranes in southeast DC this evening on my way down I-395. Many are working on residential buildings, with over a thousand luxury units coming online in next two years, adding to the several thousand in the same neighborhood over the past six or so years (I have some inside knowledge on this). They will increase supply at the high end and suppress prices at the stratospheric end somewhat but I don’t think anyone is building mid or below market units.
Likewise here in Oakland, California, it gets hard to keep up with the crane count. I can usually see about 8-10 on a drive through downtown, and there’s 3-4 more in my parents’ neighborhood. There are maybe 10,000 units on the way in a city of ~400,000. Barely any of these will be ‘affordable’, even by the city’s ridiculous math. And yet, this influx of new supply might not affect the rental prices at all.
That said, there’s so little turnover that these prices don’t reflect what people (including myself) pay for their housing. All of coastal California is starting to be divided into people with land tenure (bought a house at the right time, or have rent control) and those without. My parents, for instance, pay about $250/month in property tax on a house that would easily sell for $1.3 million! A new buyer at that price would be on the hook for about $1600/month in property taxes, and that’s before the payments on your jumbo mortgage. The nutty thing is that this is still about equal to rent on a nice house in a nice neighborhood…
Good for your parents, although I think it is absolutely insane prop 13 allows heirs to inherit all real estate , including rental properties (!) at their parents frozen tax rates. Talk about rewarding the winners…
Most local house builders were destroyed in 2008. There is not a huge profit margin in building a modest house and never was. Local home builders cannot recapitalize their businesses and cannot restaff their crews of craftsmen.
That is an unusually low spot on the list for Honolulu, and I see it’s dived almost as much as Chicago has. I wonder what’s happened there. A quick Google confirms that tourism growth has been strong in recent years, so it’s not that – although it appears wages have not risen to match.
Even the lower prices don’t look wildly out of line with historical norms, so I suppose another relevant question would be what happened around 2015 or so to drive rents into the stratosphere?
airbnb & other vacation rentals took over
“Smart” money and professionalization of renting means that they will squeeze you as much as they can while there is not regulatory framework limiting rental prices. I believe this just will worsen with time. If at the very same time you have overfinancilization and too high home sale prices the rest of the economy is doomed and productivity will decline
Why is it the government’s job to limit rent? Isn’t it our job to live in a city that we can afford?
It seems that it has become a profession to make the whole country unaffordable.
“May Wall St find where you live and f it all up” is going to become the reality for many of us.
If you’re wondering about the SF map, the left side is cold&foggy all year around. If, like a friend of mine, you have an allergy to sunlight (ok auto-immune disorder) it’s great, but otherwise…