Lambert here: I’ve never understood this fetish for certainty. Aren’t the Captain of Industry, the animals of spirit, the colossi of capital who bestride our globalized world, supposed to thrive on risk-taking, innovation, and disruption? And aren’t these uncertainty measures ripe for gaming via cognitive capture?
By Hites Ahir, Senior Research Officer, IMF, Nicholas Bloom, Professor of Economics at Stanford University, and Davide Furceri, Senior Economist in the Research Department, IMF. Originally published at VoxEU.
The global economy is growing, but so is uncertainty. This column presents a new quarterly index of uncertainty for 143 countries. The World Uncertainty Index reveals how uncertainty in the world has evolved over time, whether it is synchronised across countries, and how it compares across income groups and political regimes.
The October 2018 edition of the World Economic Outlook predicts that global economic growth will remain steady between 2018 and 2020 at the 2017 growth rate of 3.7% (IMF 2018). This exceeds the growth rate in any year between 2012 and 2016.
So, the global economy is growing, but so is uncertainty. Headlines that have appeared in the Financial Times in 2018 include: “Stocks unsettled by global trade uncertainty”, “Counting the costs of Brexit uncertainty”, “Latin America faces up to growing uncertainties”, “Italian bonds under pressure from budget uncertainty”, and “Boeing deal with Embraer faces political uncertainty”.
A Google news search for “uncertainty” gives about 0.6 million results for the whole of 2017, but 2.5 million results for the first ten months of 2018. Can we measure ‘uncertainty’ more precisely? Or compare the amount of ‘uncertainty’ in the US to that in China, the UK, or Ireland?
Measurements of economic and political uncertainty have been made only for a set of mostly advanced economies (Baker et al. 2016). We have constructed a new index of uncertainty for 143 countries using Economist Intelligence Unit (EIU) country reports. To the best of our knowledge, this is the first effort to construct a panel index of uncertainty for a large set of developed and developing countries.
Constructing the World Uncertainty Index
We constructed the World Uncertainty Index (WUI) – a quarterly index of uncertainty – for 143 individual countries from 1996 onwards. The WUI is defined using the frequency of the word ‘uncertainty’ (and its variants) in the quarterly EIU country reports. To make the WUI comparable across countries, the raw count is scaled by the total number of words in each report.
In contrast to existing measure of economic policy uncertainty, two factors help improve the comparability of the WUI across countries:
- The WUI is based on a single source. This source has specific topic coverage – economic and political developments.
- Reports follow a standardised process and structure.
The process through which the EIU country reports are produced helps to mitigate concerns about the accuracy, ideological bias, and consistency of the WUI. But we only have one EIU report per country per quarter, meaning there is potentially quite large sampling noise.
Stylised Facts
This dataset allows us to establish five key facts:
1. Global uncertainty has increased significantly since 2012. Figure 1 shows that average uncertainty has increased since 2012, well above its historical average (computed between 1996 Q1 and 2010 Q4). The index spikes near the 9/11 attacks, the SARS outbreak, the second Gulf War, the euro area debt crisis, El Niño, the Europe border-control crisis, the UK referendum vote for Brexit, and the US presidential elections.
Interestingly, while text-based measures of uncertainty have been rising since the early 2000s, financial market measures rose until about 2010, but have fallen back to low levels (Pastor and Veronesi 2017).
Figure 1 Global WUI, 1996-2018 (unweighted global average)
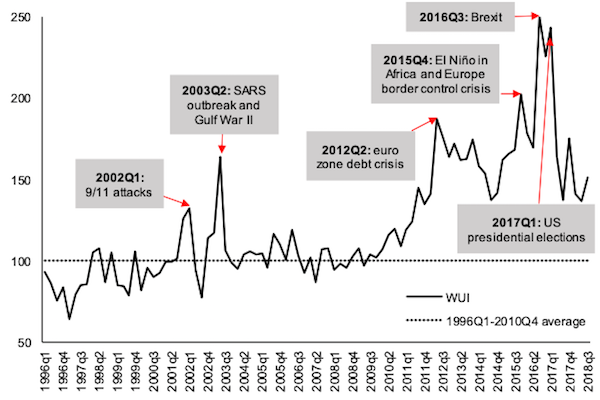
Source: Ahir et al. (2018).
Note: The WUI is computed by counting the frequency of uncertain (or the variant) in EIU country reports. It is then normalised by total number of words and rescaled by multiplying by 1,000. Here is also rescaled by the global average of 1996 Q1 to 2010 Q4 such that 1996 Q1 – 2010 Q4 = 100. A higher number means higher uncertainty, and vice versa.
2. Uncertainty spikes are more synchronised in advanced economies than in emerging and low-income countries. Within advanced economies, uncertainty synchronisation is higher in the euro area countries (Ahir et al. 2018). We find that uncertainty synchronisation is positively related with trade and financial linkages (see Figure 2), even when controlling for business cycle synchronisation, so that more integrated economies tend to be characterised by similar uncertainty spikes.
Figure 2 WUI by income group, 1996-2018
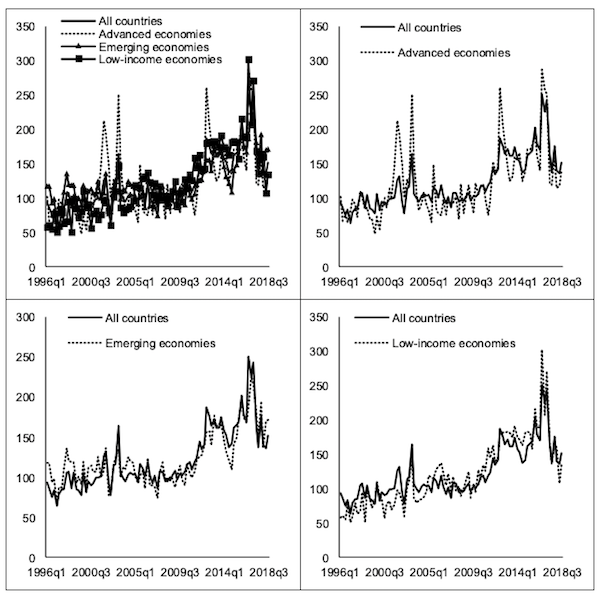
Source: Ahir et al. (2018).
3. Uncertainty is higher in emerging and low-income economies than in advanced economies. You can see this in Figure 3. There is significant heterogeneity. For example, the WUI for the UK, because of the increase in uncertainty associated by the vote in favour of Brexit, is higher than those of many emerging market and low-income countries.
Figure 3 Average WUI by income group, 1996-2018
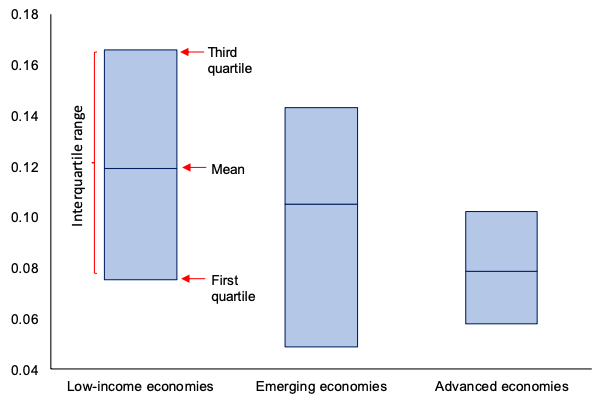
Source: Ahir et al. (2018).
4. There is an inverted U-shaped relationship between uncertainty and democracy. As countries move from a regime of autocracy and anocracy towards democracy, uncertainty increases (Figure 4). As countries move from some degree of democracy to full democracy, uncertainty declines.
Figure 4 Relationship between uncertainty and political regimes, 1996-2018
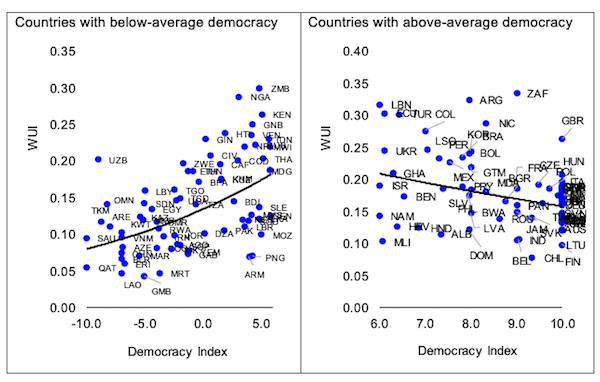
Source: Ahir et al. (2018).
Note: The democracy index comes from the Center for Systemic Peace, which classifies the country regimes as 10: full democracy, 6-9: democracy, 1-5: open anocracy, -5-0: open anocracy, and -10 to -6: autocracy. The average democracy index is 5.8.
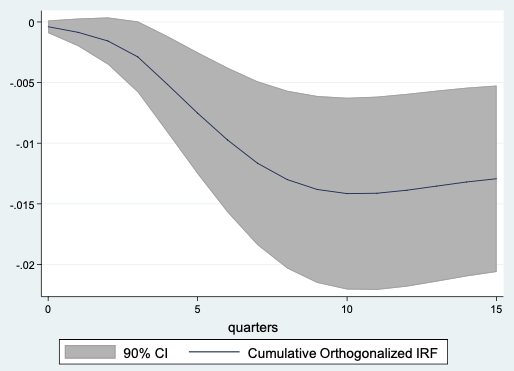
5. Increases in the WUI foreshadow significant declines in output. This is shown in Figure 5, which runs a standard panel-VAR estimation on GDP growth on shocks to the WUI uncertainty country-level index.
Figure 5 GDP response to WUI innovations, 1996-2013
Source: Ahir et al. (2018).
Note: VAR fit to quarterly data for a panel of 46 countries from 1996 Q1 to 2013 Q2. Impulse responses of GDP to a one-standard deviation increase in the WUI – equal to the change in average value in the index from 2014 to 2016 – based on a Cholesky decomposition with the following order: the log of average stock return, the WUI and GDP growth. The specification includes four lags of all variables. Country and time fixed effects are included.
A Valuable Dataset
We believe that this dataset can be extremely valuable to researches for many applications.
- First, since innovations in the WUI foreshadow significant declines in output, the WUI could be used as an alternative measure of economic activity when these are not available (such as quarterly GDP for many countries).
- Second, the dataset can be used to examine the impact of differences in the level of uncertainty across countries on key macroeconomic outcomes.
- Third, the broad country coverage allows us to tackle important research questions so far not explored because of data limitations, such as the role played by institutions and regulations in affecting uncertainty and shaping the response of economic variables to uncertainty shocks.
References available at the original.


Lambert – per your comment above – ha ha ha! It’s always “socialism for me, capitalism for thee.” Otherwise known as privatize gains and socialize losses. But you knew that…
In a world where everything (if you are lucky) is run like CalPERS, these kids don’t understand dynamic situations where they might be on the losing side.
Maximising profit required minimising labour costs, i.e. wages.
This is the paradox at the heart of neoliberalism.
66% of GDP comes from consumption in the UK economy, but neoliberalism does its best to snuff this out.
Disposable income = wages – (taxes + the cost of living)
It also lets the cost of living soar with housing costs, healthcare costs (especially US) and student loan repayments.
We want growth in the economy, but neoliberalism works against the largest component of GDP, consumer demand.
The paradox explained.
Neoclassical economics predates the GDP measure and so doesn’t consider GDP. It’s all about inflating asset prices in markets.
Getting it round the right way.
Neoclassical economics is all about inflating asset prices in markets as this is wealth creation.
Neoclassical economics predates the GDP measure and they used it in the 1920s in the US.
In the 1930s, they pondered over where all that wealth had gone to in 1929 and realised inflating asset prices doesn’t create real wealth, they came up with the GDP measure to track real wealth creation in the economy.
The transfer of existing assets, like stocks and real estate, doesn’t create real wealth and therefore does not add to GDP.
The real wealth in the economy is measured by GDP.
We forgot why they invented the GDP measure in the first place, and went back to inflating asset prices like the 1920s.
> predate
Interesting, “predate” as a verb and back-formation from predator appeared in 1974, at the beginning of the neoliberal dispensation.
I checked.
Google says:
exist or occur at a date earlier than (something).
“here parish boundaries seem clearly to predate Roman roads”
One of those wonderfully elastic and inchoate English words, then, particularly as neologisation morphs meaning in usage. As with my personal favorite, “sophisticated,” which used to mean “adulterated, debased, fraudulent, sneaky” and now carries that other glorious meaning, albeit with frissons of the former dragging along…
I will vote to include “predate” as the verb form of predation. Not than anyone cares.
it had to be an american invention because the english would have had enough sense to use the very ‘prey’
The more advanced is the economy the more to be predated and the less uncertain is this predation process.
I think the paradox is more easily explained by the event horizon. If all you are concerned with is next quarter’s stock growth then the long-term consequences of suppressing wage growth are not in your scope. Or to paraphrase Douglas Adams, “the thing is not invisible, it is just … somebody else’s problem.”
How much of Adams’ invisibility may be a form of cognitive capture? I ask because of the recent discussions about website use of tricks and tweaks to induce attention and reward via serotonin/dopamine reactions. Does that one type of potential over-stimulation accompany neglect or diminution of other forms of perception, either conscious or subconscious?
Neoliberals just want a big pool of labor.
How people in that pool survive is not its concern. All of its social engineering is geared toward keeping a big pool of labor churning with replacement parts.
So statisticians can construct an “uncertainty index,” in the context of the cancers of growth and GDP.
Maybe they could construct a “vulnerability index, then, possibly teeing off from the vulnerabilities identified by the Bulletin of the Atomic Scientists’ Doomsday Clock “algorithm:”
The Doomsday Clock is a symbol which represents the likelihood of a man-made global catastrophe. Maintained since 1947 by the members of the Bulletin of the Atomic Scientists’ Science and Security Board,[1] the clock represents an analogy for the threat of global nuclear war. Since 2007, it has also reflected climate change[2] and new developments in the life sciences and technology that could inflict irrevocable harm to humanity.[3]
The clock represents the hypothetical global catastrophe as “midnight” and The Bulletin’s opinion on how close the world is to a global catastrophe as a number of “minutes” to midnight. Its original setting in 1947 was seven minutes to midnight. It has been set backward and forward 23 times since then, the smallest-ever number of minutes to midnight being two (in 1953 and 2018) and the largest seventeen (in 1991). As of January 2018, the clock is set at two minutes to midnight, due to “the looming threats of nuclear war and climate change.”
Smart statisticians might get together with actuaries and nderwriters and people like Bill Black and, looking at the possibility of a Jackpot event as the ending condition, give us mopes a number that lets us understand how close the bus we are all riding on is to the edge. Factor in stuff like risk of collapse (again) of various bubbles like the trillions in notional dollars of “securitized derivative transactions,” the CRSP-R Kids with their unregulable new toys to assemble the molecules of life (and megadeath,) the fragility of suppl chains on which Big Data already exist, the “Mule” events like Trump and the “really smart people” developing ever more compendious ways to blow stuff up and cause people to sicken and die because “war” and its funding mechanisms, topsoil and water resource looting and loss, reappearance of chlorofluorocarbons in “the market” because profits, degree of short-term thinking by supranational corporations, a long list to be sure.
But then there are people, I bet, in the Goldman Sacks and JP Morgan corporate phalluses, and maybe even the halls of Langley and maybe even the Pentagram, who are already busy doing much or all of this work, to advise their Looter Elite clients and their own self-trading and personal ascension and accretion, on how to play the risk roulette game. Bearing in mind that their lives are, under current technology at least, a third to a half or more over, so why should they give a sh!t about what comes “Apres ils”?
The Sophisticated Modern World runs on these kinds of indexes. Why not give the mopes a clearer idea of th best guesses the Really Smart People can make about how vulnerable they are to all the calamities-in-esse or in-posse that they are “exposed to”? Calling out the inputs to the calculus more clearly might even help focus us all on how to bring efforts to bear on the most serious and mortal dangers our collective behaviors, including of course the “innovators” and “disrupters” and “regime changers” and “global military lethality and hegemony project mavens,” are raining down on us?
I imagine, of course, that such an index would most likely just reinforce passivity and the sense of futility that allow all the Neros to fiddle while Rome burns… If there’s a twenty-mile-wide asteroid on a known and inevitable collision course with our formerly beautiful little planet, do we mopes really want to know? I for one would very much like to know if things are as bad as my perceptions say they are. Might heat up some actual action to deal with the people and “institutions” that are bringing that Jackpot event ever closer.
Two minutes to midnight, folks, and the Azov Sea events, and the vicious aspirations of the neocons, and dozens of other “flash points” keep pushing the minute hand toward midnight…
Midnight prophecy made me think of this
https://en.wikipedia.org/wiki/When_Prophecy_Fails
Which came up recently in Rutger Bregman’s ‘Utopia for Realists’. The 4:45am ‘event’ in the best one.
(not that I am trying to dis anything said above or the danger of our times)
This is an interesting and neat little statistic, but I want to fiddle around with this data a bit.
Some thoughts:
“As countries move from a regime of autocracy and anocracy towards democracy, uncertainty increases (Figure 4)”
The WUI x Democracy Index is probably confounded by the level of media freedom in the country. I could see this easily effecting the EIU report. That data is readily available in these reports so if I have time later I can take a look.
Also I have a hunch that the amount of words in an individual country’s EIU report is correlated with numerous factors, such as country size, population, integration with world economy, etc. Since WIU = (occurrences of uncertainty in EIU report)/(# of words in report) this could be an issue.
My favourite word whose meaning has morphed into its opposite is “egregious.”
Well we can at least count on one source of stability though it might not bring us much comfort and that’s fed chairman Jay Powell propping up markets with easy money like his predecessors did, most famously Mr. Bernanke.
“There is an inverted U-shaped relationship between uncertainty and democracy. As countries move from a regime of autocracy and anocracy towards democracy, uncertainty increases (Figure 4). As countries move from some degree of democracy to full democracy, uncertainty declines.”
Where was the definition of all the alleged democracy referred to in this article?
I don’t see any democracies anywhere.
As a wise man once said “It all depends upon what you mean.” I note relatively little overall “uncertainty” from the baseline in the years before the global financial crisis – and also not much of a rise until 2010
something seems off when the WUI is flat between 2004 and 2010, completely ignoring the GFC