By Juan C. Palomino, Research Officer, Institute for New Economic Thinking, University of Oxford; Gustavo A. Marrero, Professor of Economics and Director, Research Center of Social Inequality and Governance (CEDESOG), University of La Laguna; and Juan Gabriel Rodríguez, Professor of Economics, Universidad Complutense de Madrid. Originally published at VoxEU
The American Dream is grounded in the US being the land of opportunities, but real opportunity requires mobility across generations. This column examines the influence of parents’ income on the income of their children in the US for the period 1980-2010. Parental income has a greater influence, implying lower levels of mobility, for families with the highest and lowest levels of income. Education also plays a stronger role in economic persistence at both tails of the income distribution, while race affects mobility in the middle and lower parts of the distribution.
The idea of the US being a land of opportunities relies on the perception that intergenerational income mobility in the country is high. However, this commonplace perception has been questioned in the last decades.
The most widely used measure of intergenerational economic mobility is intergenerational income elasticity (IGE), a coefficient obtained via a regression model that captures the statistical connection between parents’ income and their children’s income in later life. The higher the value of IGE, the greater the connection between income from both generations and therefore the lower the intergenerational mobility.
The first studies estimating IGE for the US found relatively low values of around 0.2. implying that just 20% of the difference between individual incomes could be explained by parental income. However, using better databases and correcting for measurement errors, Solon (1992) and Zimmerman (1992) established IGE estimates of about 0.4, suggesting much greater intergenerational dependence (or immobility). Later on, methodological refinements aimed to better correct for transitory shocks and lifecycle bias (Mazumder 2005) resulted in estimated values of about 0.5. This finding spurred subsequent research analysing IGE in the US and around the world, with the US consistently ranking higher in IGE and showing less mobility than other countries with similar degrees of development (Corak 2006, Björklund and Jäntti 2009, Blanden, 2013).
One important limitation of this literature is that most studies derive IGE from a regression-to-the-mean model using ordinary least squares (OLS), reflecting the connection only at the mean of the income distribution and paying little attention to the possible differences in IGE at the higher and lower income tails. The few studies that did estimate IGE in the US at different quantiles of the distribution did not find a clear pattern of IGE across the income distribution, but they were based on cross-sections with small samples (Eide and Showalter 1999, Grawe 2004, Cooper 2011). With respect to the evolution of IGE, studies have focused only on the mean and have arrived at disparate results (Hertz 2007, Aaronson and Mazumder 2008, Lee and Solon 2009).
Intergenerational Mobility Across the Income Distribution
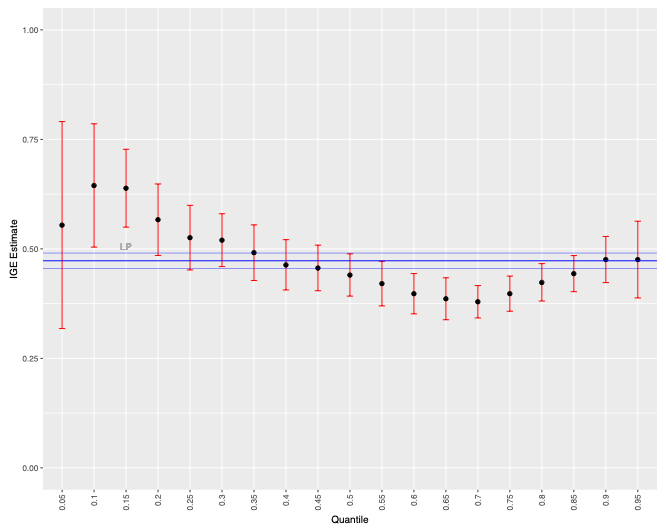
In a recent paper (Palomino et al. 2018), we have estimated IGE in the US for the period 1980-2010 by applying a (conditional and unconditional) quantile regression (Koenker 2005, Firpo et al. 2009) to the model proposed by Lee and Solon (2009). This strategy allows us to use observations of individuals at different points of the lifecycle and to enlarge the available dataset. In this manner, we obtain more accurate estimations at the tails of the distribution while controlling for lifecycle bias and measurement error. We estimate an IGE value for the pooled sample of 0.47 at the mean of the income distribution, which is in line with the literature. More importantly, we observe a U-shaped pattern in the parental income influence on children’s income. Thus, IGE is highest at the lower quantiles of the distribution (0.6 at the 5th to 20th percentiles), falls to a minimum of around 0.38 at the 70th percentile, and then increases again up to almost 0.5 at the 90th to 95th percentiles (Figure 1).
Children in the upper-middle part of the conditional distribution show the smallest degree of intergenerational persistence, while top incomes and, especially, low incomes are very much conditioned by parental income. Interestingly, previous studies did not find an increase of IGE in the US from the 70th percentile onwards. Apart from the much bigger sample under consideration in our work, the observed difference is most likely due to the variable used – i.e. household income (instead of earnings) – which includes capital income, through which a great deal of the correlation between parental and children incomes in the upper part of the distribution occurs.
Figure 1 IGE across the distribution
Evolution of IGE in the US from 1980 to 2010
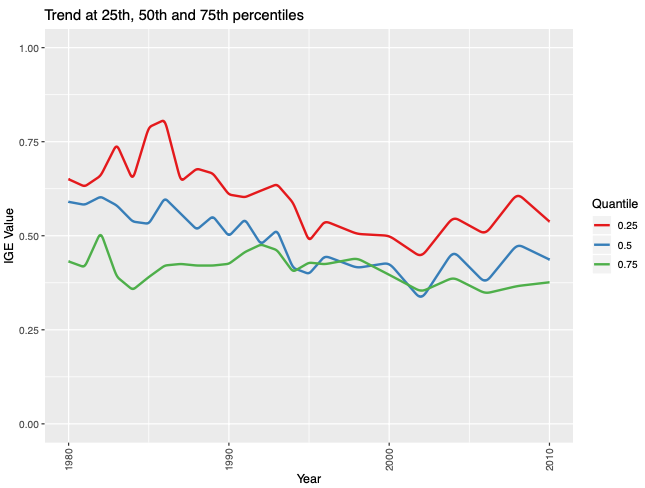
For the OLS estimation at the mean, IGE shows a decreasing trend in the first two decades analysed, followed by an increase in the 2000s. By quantiles, the estimates show that, below the median, IGE decreased in the 1980s and 1990s and increased in the 2000s, with a pattern that is more pronounced at the lowest quantiles. Above the median, both the mid-to-high and the high-income quantiles maintained a steady value of IGE along the three decades analysed and showed only a very mild decreasing pattern in the 1990s that turns into an increase in the 2000s. The new century was a turning point in the IGE trends for all income groups but especially for the poorer, with an increase in elasticity (i.e. a decrease in mobility) since 2002. (Figure 2).
Figure 2 Evolution of IGE,1980-2010
The Role of Education and Race
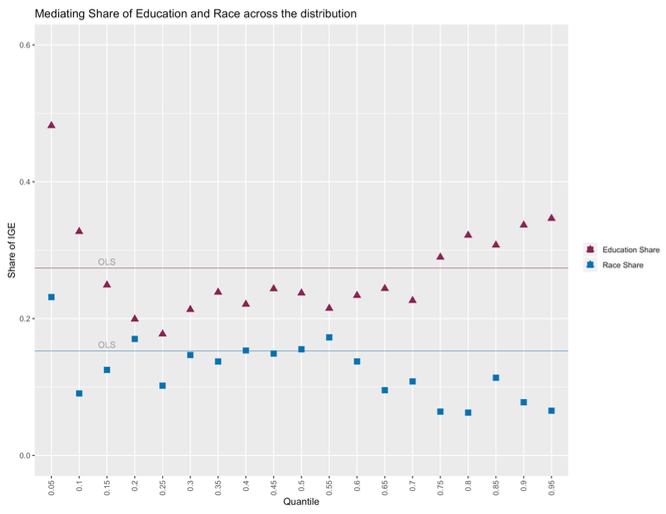
When education is included in the regression, the estimated IGE decreases 27.4% at the mean. This result is similar to Eide and Showalter (1999) and Cooper (2011), who find a mediating role of education in the persistence of income across generations of approximately 30%. Results by quantiles show that the share of IGE mediated by education varies between 20% and 48% depending on the position at the distribution. The share is around 20% for the 20th to 70thpercentiles and increases significantly when reaching the extremes of the distribution (Figure 3). Thus, despite there being no control for the quality of the schools, we find that between one fifth and half of intergenerational income transmission can be explained by the level of education that parents can provide to their children.
When race is also included in the regression, the estimated IGE decreases 10% at the mean (i.e. one tenth of the ‘inheritance’ of parental income is attributed to the race of the individual), controlling for education. Across quantiles, the importance of race is around 10% in the bottom half of the distribution and 5% from the 60th percentile upwards.
Figure 3 Share of intergenerational transmission of income mediated by education and by race
Promoting Intergenerational Mobility for the Whole Distribution
Policies that equalise individual opportunity may promote not only equity but also economic growth (Marrero and Rodríguez 2013, Marrero et al. 2016). By boosting intergenerational mobility, an important source of unequal opportunities – namely, parental income transmission – will be curbed. However, to increase equity and growth simultaneously, policies that reduce the persistence of parental influence on children’s income should consider the position in the income distribution, since income transmission varies across percentiles. The education system is one of the key channels for the transmission of income across generations, and therefore is one of the main sectors in which such tailored policies should be implemented.
See original post for references


Conclusion: tax white-privileged parents on behalf of non-white children. Can this be construed as a race tax? It’s even quantified- 10%.
In a way, this is already being accomplished with progressive tax schedules. I suppose the author is a proponent of a further 10% skew.
Equal Opportunity(tm) is such a moving target, especially when couched in terms of race. I’m beginning to see the concept more as a rhetorical device than a core American tenet. And judging from the list of socially woke authors of European provenance, propounding upon the American Dream(tm), the premises>conclusions are decidedly tail wagging the dog.
maybe I’m crazy but aren’t student loans a tax on the poor to increase the value of what the rich give to their children (just as the aca made rich peoples insurance cheaper, yay!)? ie how many rich parents make their kids get student loans, with the likely answer “none” because “knowledge eCONomy”. Easy money drives up the value of the asset for those at the top, see sub prime loans. Student loans are the same predatory sub prime easy money that drives up costs, so one must borrow more, unless your parents can pay, in which case major head start. You focus on race and I see that as secondary to class in this case, the relevance of including it in the analysis is the current long term disparity between races make it a useful marker.
To an extent, the education industry has watched various authorities assert that “college is always a worthwhile investment” and observed the published delta in lifetime earnings for college vs non-college graduates (in past years).
This means there is an asserted consumer surplus arising from getting a college degree.
The colleges and loan industry grabbed (over grabbed?) much of this asserted consumer surplus in the last decade for themselves.
But as many are finding out, the delta in lifetime earnings for college vs non-college graduates may be negative for a high priced degree with little earning power vs a less expensively educated non-college worker with an in-demand skill.
If the USA were a land of many opportunities there would be many different good opportunities and many different ways to achieve good wages.
But the press seems to indicate many parents passionately believe getting their children into the right school with the right major is the ONLY way to achieve success.
This suggests many people in the USA do NOT see it as a land of opportunity for most.
Currently reading Cathy O’Neill’s Weapons of Math Destruction about the dangers of allowing algorithms to make all of our decisions and she makes a very strong case that the reason that parents believe this is largely due to US News and World Report’s annual college rankings. Not only do parents pay too much attention to this list, but so do the schools themselves to the point where many have begun trying to game the ranking algorithm US News uses to the detriment of not just students, but to their own schools.
One example she uses is overall acceptance rate, where a lower acceptance % translates to a higher ranking. Some schools have decided to simply accept fewer students in order to drive the rate down and she mentions that the way some do this is to stop accepting the really good students who they feel won’t come even if they are accepted – essentially colleges are trying to weed out applicants they believe are applying only if they need a ‘safety school’. So rejecting better students then leads to a higher ranked institution.
Lies, damn lies, and statistics.
I don’t want equal opportunity, I want much more equal results (and if we had that opportunity would take care of itself)
Even Piketty asserted that wealth tends to dissipate in a generation or two – significant wealth takes a little longer. A lot has to do with IQ and demeanor. Genomically-speaking, birds of a feather do flock together, and when they do, the family gene pool overflows with talent. As Trump has demonstrated, some birds prefer to fly around with birds of a different feather, and the family gene pool remains half empty.
So, of course, there will be a U-shaped curve for intergenerational wealth. At the bottom, you have no place to go but up. At the top, inherited wealth will not grow without prudent investing by bright birds of a feather. Family wealth can help to keep you out of jail, out of war, and into college. However, once independent, history suggests that inherited wealth dissipates as inherited talent and demeanor enable. My own extended family’s history (.5% in 1980) reflects that fact (.75% today and falling fast).
The gross maldistribution of wealth in the US is not due so much to family inheritance as it is due to public policy that enables the wealthy to form monopolies, corrupt politicians, and dodge taxes.
But doesn’t the data show the opposite? Those with parents at the top and bottom are the most likely to stay at the top and bottom and those in the middle are the most likely to swing one way or another.
But you suggesting inverted-U curve, with *lower* correlation at the ends vs in the middle (nowhere to go but up) while the article actually found a regular U curve.
Notice how everyone at the top has been to an Ivy League University?
Social mobility is at the same atrocious level as the UK and they use the same mechanisms for social stratification, private schools and universities (they take no chances in the US).
this somewhat agrees with what i learned in school a few years back–you can pretty much say that those who have less than college are going to stay around what their parents are, SES wise. same for those with advanced/professional degrees, as they will usually at least attain if not supersede their parents’ achievements academically and professionally. it was at the Baccalaureate level that all bets were off, and a wider variety of outcomes were happening.
but, if most of your academic achievement is the also the result of your parental SES–as we know, school districts, poor housing, troubles at home, insecurity in housing and food, even too crowded conditions or too much noise in the home impacting study and GPA, then basically we have a caste system. you can’t progress in other areas of your life usually unless you overcome the educational hurdle.
along comes all kinds of fiddling to deny that basically what you have to do is redistribute income to ensure that this doesn’t happen–means testing, tax schemes, head start programs, preschool to “undo” the parenting of the poors. bandaids on a exit wound. but the technocratic class (the higher middle–the ones who are closer to saying with some certainty that they “earned it”) is beloved of those solutions. those solutions keep them employed, and managing the system, thus empowered.