Yves here. It’s instructive to see a new angle on the taxonomy of capitalist societies, this one looking at data to tease out the impact of class.
By Marco Ranaldi, Postdoctoral scholar, Stone Center on Socio-Economic Inequality at the Graduate Center, CUNY and Branko Milanovic, Visiting Presidential Professor, Graduate Center, University of New York and Senior Scholar, Luxembourg Income Center. Originally published at VoxEU
Similar levels of income inequality may coexist with completely different distributions of capital and labor incomes. This column introduces a new measure of compositional inequality, allowing the authors to distinguish between different capitalist societies. The analysis suggests that Latin America and India are rigid ‘class-based’ societies, whereas in most of Western European and North American economies (as well as in Japan and China), the split between capitalists and workers is less sharp and inequality is moderate or low. Nordic countries are ‘class-based’ yet fairly equal. Taiwan and Slovakia are closest to classless and low inequality societies.
Similar levels of income inequality may be characterised by completely different distributions of capital and labour. People who belonged to the highest income decile in the US before WWII received mainly capital incomes, whereas in 2010 people in the highest decile earned both high labour and capital incomes (Piketty 2014). Yet the difference in their total income shares was small.
Different distributions of capital and labour describe different economic systems. Two polar systems are particularly relevant. In classical capitalism – explicit in the writings of Ricardo (1994 [1817]) and Marx (1992 [1867], 1993 [1885]) ¬– a group of people receives incomes entirely from ownership of assets while another group’s income derives entirely from labour. The first group (capitalists) is generally small and rich; the latter (workers) is generally numerous and poor, or at best with middling income levels. The system is characterised by high income inequality.
In today’s liberal capitalism, however, a significant percentage of people receive incomes from both capital and labour (Milanovic 2019). It is still true that the share of one’s income derived from capital increases as we move higher in the income distribution, but very often the rich have both high capital and high labour incomes. While inter-personal income inequality may still be high, inequality in composition of income is much less.
The purpose of our study is to introduce a new way of looking at inequality that allows us to classify empirically different forms of capitalism. In addition to the usual inter-personal income inequality, we look at inequality in the factoral (capital or labour) composition of people’s incomes. The class analysis (where class is defined narrowly depending on the type of income one receives) is thus separated from the analysis of income inequality proper.
Which countries around the world are closer to classical, and which to liberal capitalism? Does classical capitalism display higher inter-personal income inequality than liberal capitalism? Can we find what we term ‘homoploutic’ societies – where everyone has approximately the same shares of capital and labour income? Would such homoploutic societies display high or low levels of income inequality?
To answer these questions, in Ranaldi and Milanovic (2020) we adopt a new statistic, recently developed by Ranaldi (2020), to estimate compositional inequality of incomes: the income-factor concentration (IFC) index. The income-factor concentration index is at the maximum when individuals at the top and at the bottom of the total income distribution earn two different types of income, and minimal when each individual has the same shares of capital and labour income. When the income-factor concentration index is close to one (maximal value), compositional inequality is high, and a society can be associated to classical capitalism. When the index is close to zero, compositional inequality is low and a society can be seen as homoploutic capitalism. Liberal capitalism would lie in-between. Negative values of the income-factor concentration index, which describe societies with poor capitalists and rich workers, are unlikely to be found in practice.
By applying this methodology to 47 countries with micro data provided by Luxembourg Income Study from Europe, North America, Oceania, Asia, and Latin America in the last 25 years and covering approximately the 80% of world output, three main empirical findings emerge.
First, classical capitalism tends to be associated with higher income inequality than liberal capitalism (see Figure 1). Although this relationship was implicit in the minds of classical authors like Ricardo and Marx, as well as in recent studies of pre-WWI inequality in countries that are thought to have had strong class divisions (Bartels et al. 2020, Gómes Léon and de Jong 2018), it was never tested empirically.
Figure 1
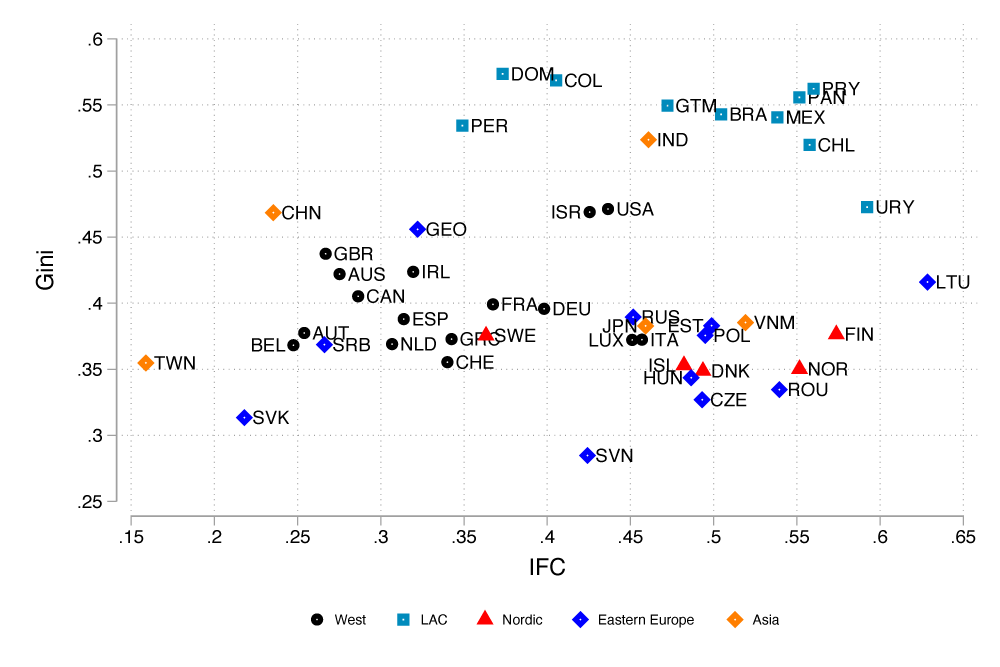
Note: The graph shows on the horizontal axis compositional inequality and on the vertical axis the standard measure of inter-personal income inequality (Gini coefficient). Nordic countries (Finland, Sweden, Norway and Denmark) are marked in red.
Second, three major clusters emerge at the global scale. The first cluster is the one of advanced economies, which includes Western Europe, North America, and Oceania. Relatively low to moderate levels of both income and compositional inequality characterise this cluster. The US and Israel stand somewhat apart from the core countries since they display higher inequality in both dimensions.
Latin American countries represent the second cluster, and are, on average, characterised by high levels in both inequality dimensions.
The third cluster is composed of Nordic countries and is exceptional insofar as it combines low levels of income inequality with high compositional inequality. This is not entirely surprising: Nordic countries are known to combine wage compressions with ‘socially acceptable’ high returns to capital (Moene and Wallerstein 2003, Moene 2016). Such compromise between capital and labour (reached in the early 1930s) has put a cap on earning inequality within the region (Fochesato and Bowles 2015) but has left wealth inequality untouched (Davies et al. 2012). By drastically reducing the progressivity of capital income taxation (Iacono and Palagi 2020), income tax reforms during the 1990s have worked in the same direction.
Several other results are found. Many Eastern European countries are close to the Nordic cluster. Some (Lithuania and Romania) have very high compositional inequality, likely the product of concentrated privatisation of state assets. India is very similar to the Latin American cluster, displaying a class-based structure with high levels of income inequality.
Taiwan and Slovakia are, instead, the most ‘classless’ societies of all. They combine very low levels of income and compositional inequality. This makes them ‘inequality-resistant’ to the increase in the capital share of income. In other words, if capital share continues to rise due to further automation and robotics (Baldwin 2019, Marin 2014), it will not push inter-personal inequality up: everybody’s income would increase by the same percentage. The link between the functional and personal income distribution in such societies is weak – the topic of a previous VoxEU column by Milanovic (2017b). It is also interesting that Taiwan is both more ‘classless’ and less unequal than China.
The third, and perhaps most striking result that emerges from our analysis is that no one country in our sample occupies the north-west part of the diagram. We find no evidence of countries combining low levels of compositional inequality (like those of Taiwan and Slovakia) with extremely high levels of income inequality (like in Latin America).
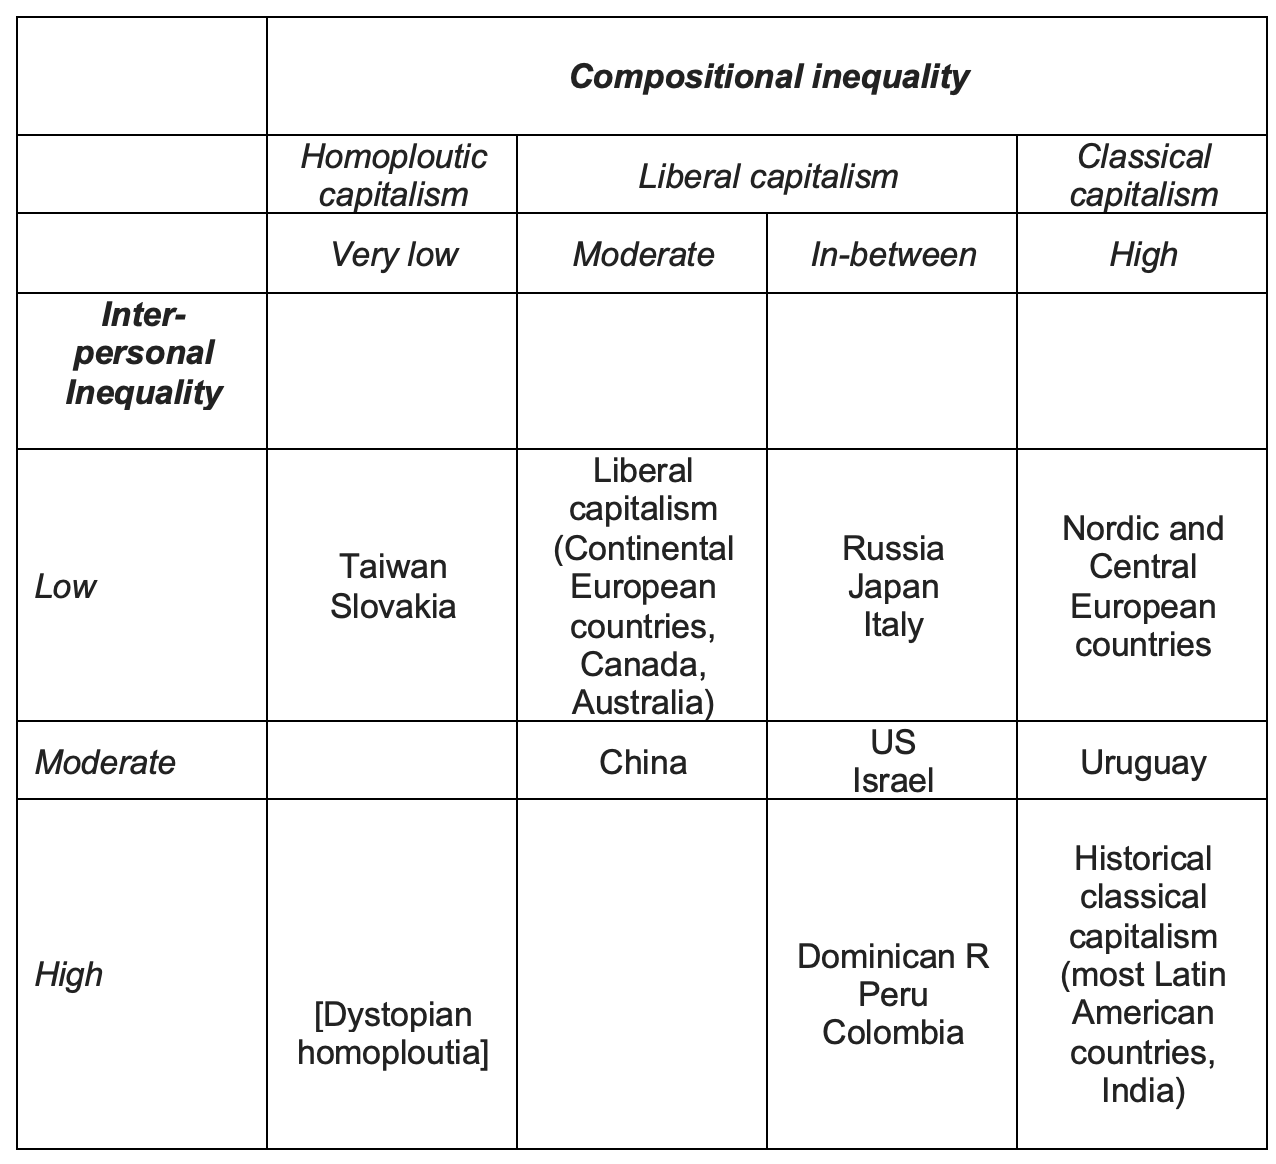
To conclude, we propose a novel taxonomy of varieties of capitalism on the basis of the two inequality dimensions (Table 1). We believe such taxonomy brings a strong empirical and distributional focus into the literature on the varieties of capitalism, as well as a larger geographical coverage.
Table 1 Nomenclature of capitalism
See original post for references


1. The role of government is unmentioned. That strikes me as odd.
2. Does this categorize management salaries and Wall Street hundred million dollar bonuses as “labor”? That also strikes me as odd.
Also, what counts as “income”? Does it include stock options or are those capital earnings? Additionally, what about tax issues that might skew the distribution? Owners may want to take “income” out of their companies instead of increasing their ownership or capital value as that allows them diversification. Although this is all very interesting but it may just simply reflect more complex tax avoidance strategies rather than a change in the nature of capitalism.
I’d ask too, “what counts as labor?”
I could be wrong but isn’t high labour income a characteristic of the “merely” rich, the salaried upper crust of the PMC? The very rich forego their labour income with symbolic $1 gestures and choose instead to get paid in capital (stock). The high labour income of the merely rich gets recycled into ownership of more capital, meaning over time the income composition of this cohort tracks closer to that of the very rich I.e high capital low labour . A different angle on income inequality as suggested by the authors of course does little to stem the tide of where the most pernicious inequality is manifesting, wealth concentration (to say nothing of it being academic to the poor and oppressed people of the world who subsist on little to no income).
“$1 salary gestures” meant to say
Some very interesting work here. It is especially relevant now that the pandemic has suppressed the income from labor. I had a few thoughts while reading through this – not so much critiques as possible directions for future work with this taxonomy.
The legend in the figure 1, grouping of countries by region, highlights some interesting clusters but its not exactly clear what to make of them. Two dimensions that could be interesting to look at here are 1: overall population and 2. geographical size. Overall population would impact the size of the labor pool and geographic size may be related to assets – more specifically land ownership.
Including pop and geographic size probably won’t give you a nice linear relationship with IFC right away, but it could help frame yet another dimension: history, specifically history of imperialism. My assumption would be that the historically imperialist nations in Europe exhibit a lower IFC – an increase in assets taken from colonies combined with relatively low populations, indirectly decreasing the labor pool. Conversely, historically colonial nations in South America exhibit higher IFC due to greater geographical size which in turn yields greater natural resources for plundering. This plundering could also tilt income more towards the labor side in these countries, as there is greater extraction of natural resources and those resources would turn into assets that leave the country.
Speaking of history, it may also be interesting to consider how IFC changes over time. This would be especially interesting if we take look between generations and within generations. Between generation changes in IFC could capture changes in a countries IFC over time – maybe some interesting stuff in post-colonial countries. The within generations changes in IFC could capture economic mobility in a country. If I am understanding this measure correctly, IFC should decrease as a generation ages in an economically mobile countries. The idea here being that when one is younger, most income derives from labor and over time that income is used to purchase assets, which in turn will lead to more asset based income when one is older. In other words, within-generation decreases in IFC might be associated with more economically mobile capitalist societies, whereas a relatively stable within-generation IFC might be associated with less economically mobile capitalist societies.
Again, this IFC derived taxonomy is really interesting and I’m quite interested to see where this work is headed!
How reassuring to know that in “North America” inequality is moderate or low.
Surprising to see something as baldly risible as that observation, in an article at this site.
Canada vs U.S.?
There’s also the issue of what personal incomes have to pay for. In countries with (say) inexpensive housing, national health care, and free education, it may be possible to have a decent life on relatively little money. But if we have to pay through the nose for the basics, lack of money can mean a life of poverty and an early death. Increasingly it seems like the U.S. is in that situation.
If you look at their chart, USA clusters nearer to Latin America along with Mexico.
Seemed like a misinterpretation of their own data.
It’s hard to imagine how this question was formed. What do they consider capitalism to be? Strictly living off of invested investment returns? That’s just crazy. Especially in a world where labor is replaced increasingly by automation which should be considered to be capital. So exactly how do they combine labor income with capital income? The question is, what is labor and how do we distribute the burden of labor so that it is equalized and nobody gets to skate on income from invested capitalized labor capital.
So exactly how do they combine labor income with capital income?
I am not an Economist nor do I play one on Television, however in thinking on this ?? myself (needing some example for a handle), I’m thinking of a MD/City Mgr./Dept. Chair Labor? type(ie not exclusive) tied into Rental Property Capital (ie not exclusive).
or maybe some Homeowner with 23 years at GM Lordstown that took a Transfer to Terre Haute when the plant closed and rents their old homeplace in Warren out. You can Internationalize it.
I wanted to know some of the traits that set Taiwan and Slovakia apart. I’ve not visited Taiwan, but on Slovakian roads I passed by horse carts and Mercedes
Perhaps the rise of working rich in the West is a result of the decline in the philanthropic rich.
The new heights set by Bezos and Musk has the great mass of multimillionaires feeling dreadfully inadequate. If studies are correct, we compare ourselves to the rungs above us.
Also, Americans are as class conscience and class obsessed as any society. Read Paul Fussell’s 1983 humorous guidebook. We go about it differently and it is no less harsh. Just take a look at our justice system with its country club prisons for white collars and crowded slums for blue collar minorities and immigrants. We are not superior to other countries and traditional societies on this point.
“The degree of civilization in a society can be judged by entering its prisons.” – Fyodor Dostoevsky
The posh jobs of failchildren in this generation are probably better understood as economic rent than income. I’m not sure that the income of hedge fund managers is also best considered income, either. I don’t know how useful this guide is going to be using simple definitions.
I get the feeling that this data conceals more than it reveals, particularly in the US.
A general lack study design and critical definitions, like how wealth and income nuances are determined make this study its novel taxonomy essentially worthless.