Yves here. I am sure readers will have fun taking apart this post. On its face, the finding that GDP in Ukraine in April was only 15% below pre-war levels seems absurd. The country has 13 million refugees out of a population of about 41 million, with the breakdown according to the UN of 5 million fleeing abroad, the rest displaced internally. Rumor has it that a fair number of those who left Ukraine are conscription (meaning also working) age men seeking to avoid becoming cannon fodder.
Of course, Ukraine GDP is being pumped up by the US paying directly for Ukraine government operations, as well as the revenues from selling all those weapons sent to Ukraine on the black market.
Being a bit more serious, I can’t see how using Twitter activity or Google searches are a proxy for economic activity, particularly since Russia (so far) has courteously left the lights, the Internet, and cell towers all working. People communicate and look for information more in times of crisis; that does not mean they are transacting more.
Of course, arguably Russia’s reconstruction, which has started in Mariupol, as well as resuming pension payments, are GDP additive. But the authors are also charitably treating the breakaway republics and the occupied parts of oblasts like Kherson and Zaporizhia as part of Ukraine GDP, when Russia has been converting local banks over to the rouble and making pension and other payments in roubles. Shouldn’t these territories be excluded, since at a minimum Ukraine is presently not collecting taxes from them nor providing services to them (wellie, although the expenditures to recapture them must count, even if that also means including the shelling of civilians in Donetsk). For those who want to make more granular estimates, Wikipedia helpfully has a breakdown of Ukraine GDP by oblast.
By Mihnea Constantinescu, Head of Research, National Bank of Ukraine; Kalle Kappner
Postdoc, Institute for Economic History, Humboldt University Berlin; and Nikodem Szumilo, Associate Professor, University College London; Director, Bartlett Real Estate Institute. Originally published at VoxEU
The war in Ukraine has severely limited the ability to gather statistical information and assess the impact on the country’s economy. This column uses high-frequency data from night lights, online search behaviour, and social media activity to estimate the economic impact on Ukrainian regions. It suggests that economic activity decreased by 45% at the beginning of the war, but recovered to around 85% of pre-war levels in April. Timely assessments of human and capital losses will be crucial in the discussion of optimal post-war redevelopment strategies.
The recent full-scale Russian invasion of Ukraine and the subsequent introduction of martial law imposed severe limitations on data gathering and processing by Ukrainian state statistical agencies. The lack of timely data makes it difficult to assess the scale and speed of changes in the Ukrainian economy, and so impinges on policymaking. Timely assessment of human and capital loss1 along with estimates of GDP contraction are valuable inputs in the ongoing discussion on optimal post-war redevelopment strategies (Garicano et al. 2022, Becker et al. 2022).
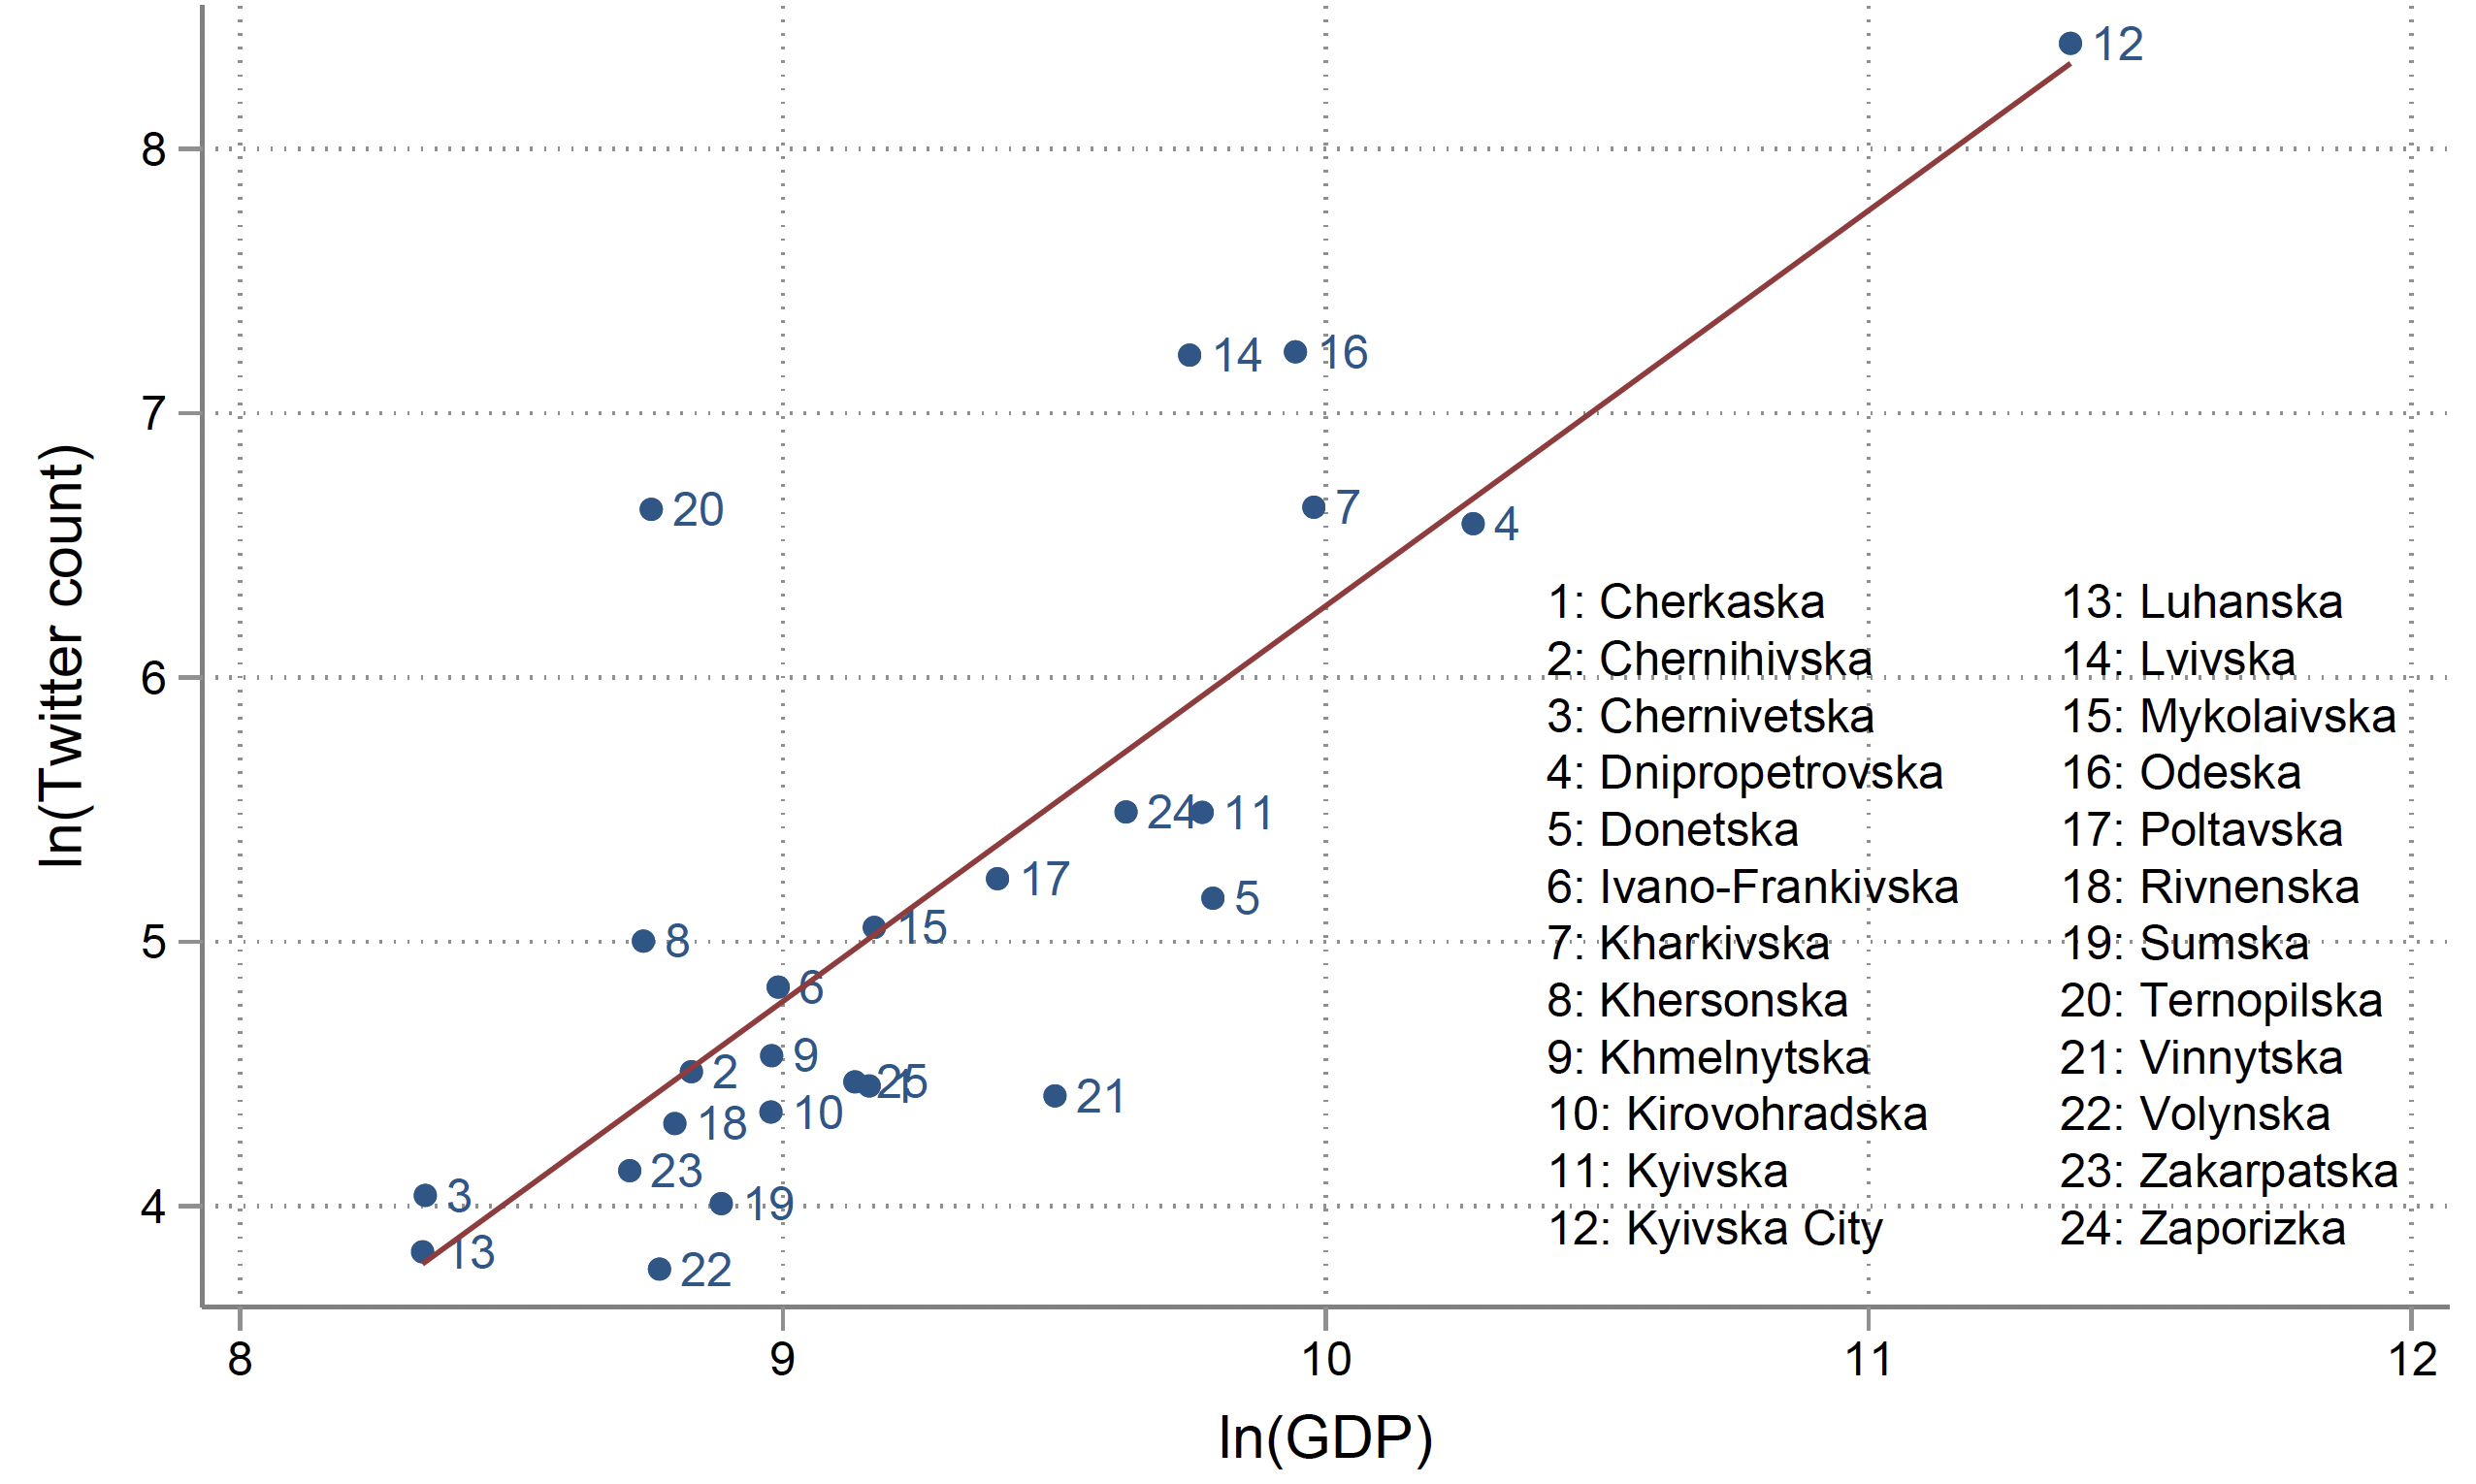
Figure 1 GDP versus Twitter count by region (2019)
To understand the short-term impact of the war on economic activity, we aggregate high-frequency predictions of the gross regional product in Ukrainian regions. Our predictions are based on variables and specifications identified in the literature to accurately track GDP during catastrophic events such as natural disasters or armed conflict: intensity of light at night, online search behaviour, and social media activity.
Our preliminary analysis suggests that economic activity decreased to around 55% of its pre-war levels at the beginning of the war but recovered to around 85% in April (Constantinescu et al. 2022).
Proxies of Economic Activity
We build on recent advances in development economics linking unconventional big data to changes in economic activity. While imperfect, they are widely used to complement, improve, and even replace conventional measures of economic activity (for example during natural disasters) when these are lacking.
In large countries with diverse economic bases, regional considerations of the relevant local shocks add important detail in understanding aggregate developments (Fingleton and Szumilo 2019). It is also worth noting that neither the location nor the timing of military activity on either side of the war is likely to be exogenous to economic activity. Since 30% of Ukraine’s GDP comes from Kyiv and Kyiv Oblast, but less than 2% from Kherson Oblast, regional activity is crucial to properly assessing the macro effects of the war. A conventional war is inherently a geographical crisis, with damage of varying intensity over time and unevenly spread over space. Therefore, tracking its impact (even at the macro scale) requires a geographically disaggregated analysis at high frequency. These dimensions, along with available data constraints, dictated the feasible space of possible nowcasting and forecasting solutions.
In a macro analysis context, high frequency indicators are volatile and more difficult to interpret than established statistical data. Nevertheless, they act as credible proxies in an emergency, as indicated during the Covid-19 pandemic when the use of noisy but high-frequency data become a major advantage (Woloszko 2020, Chetty et al. 2020).
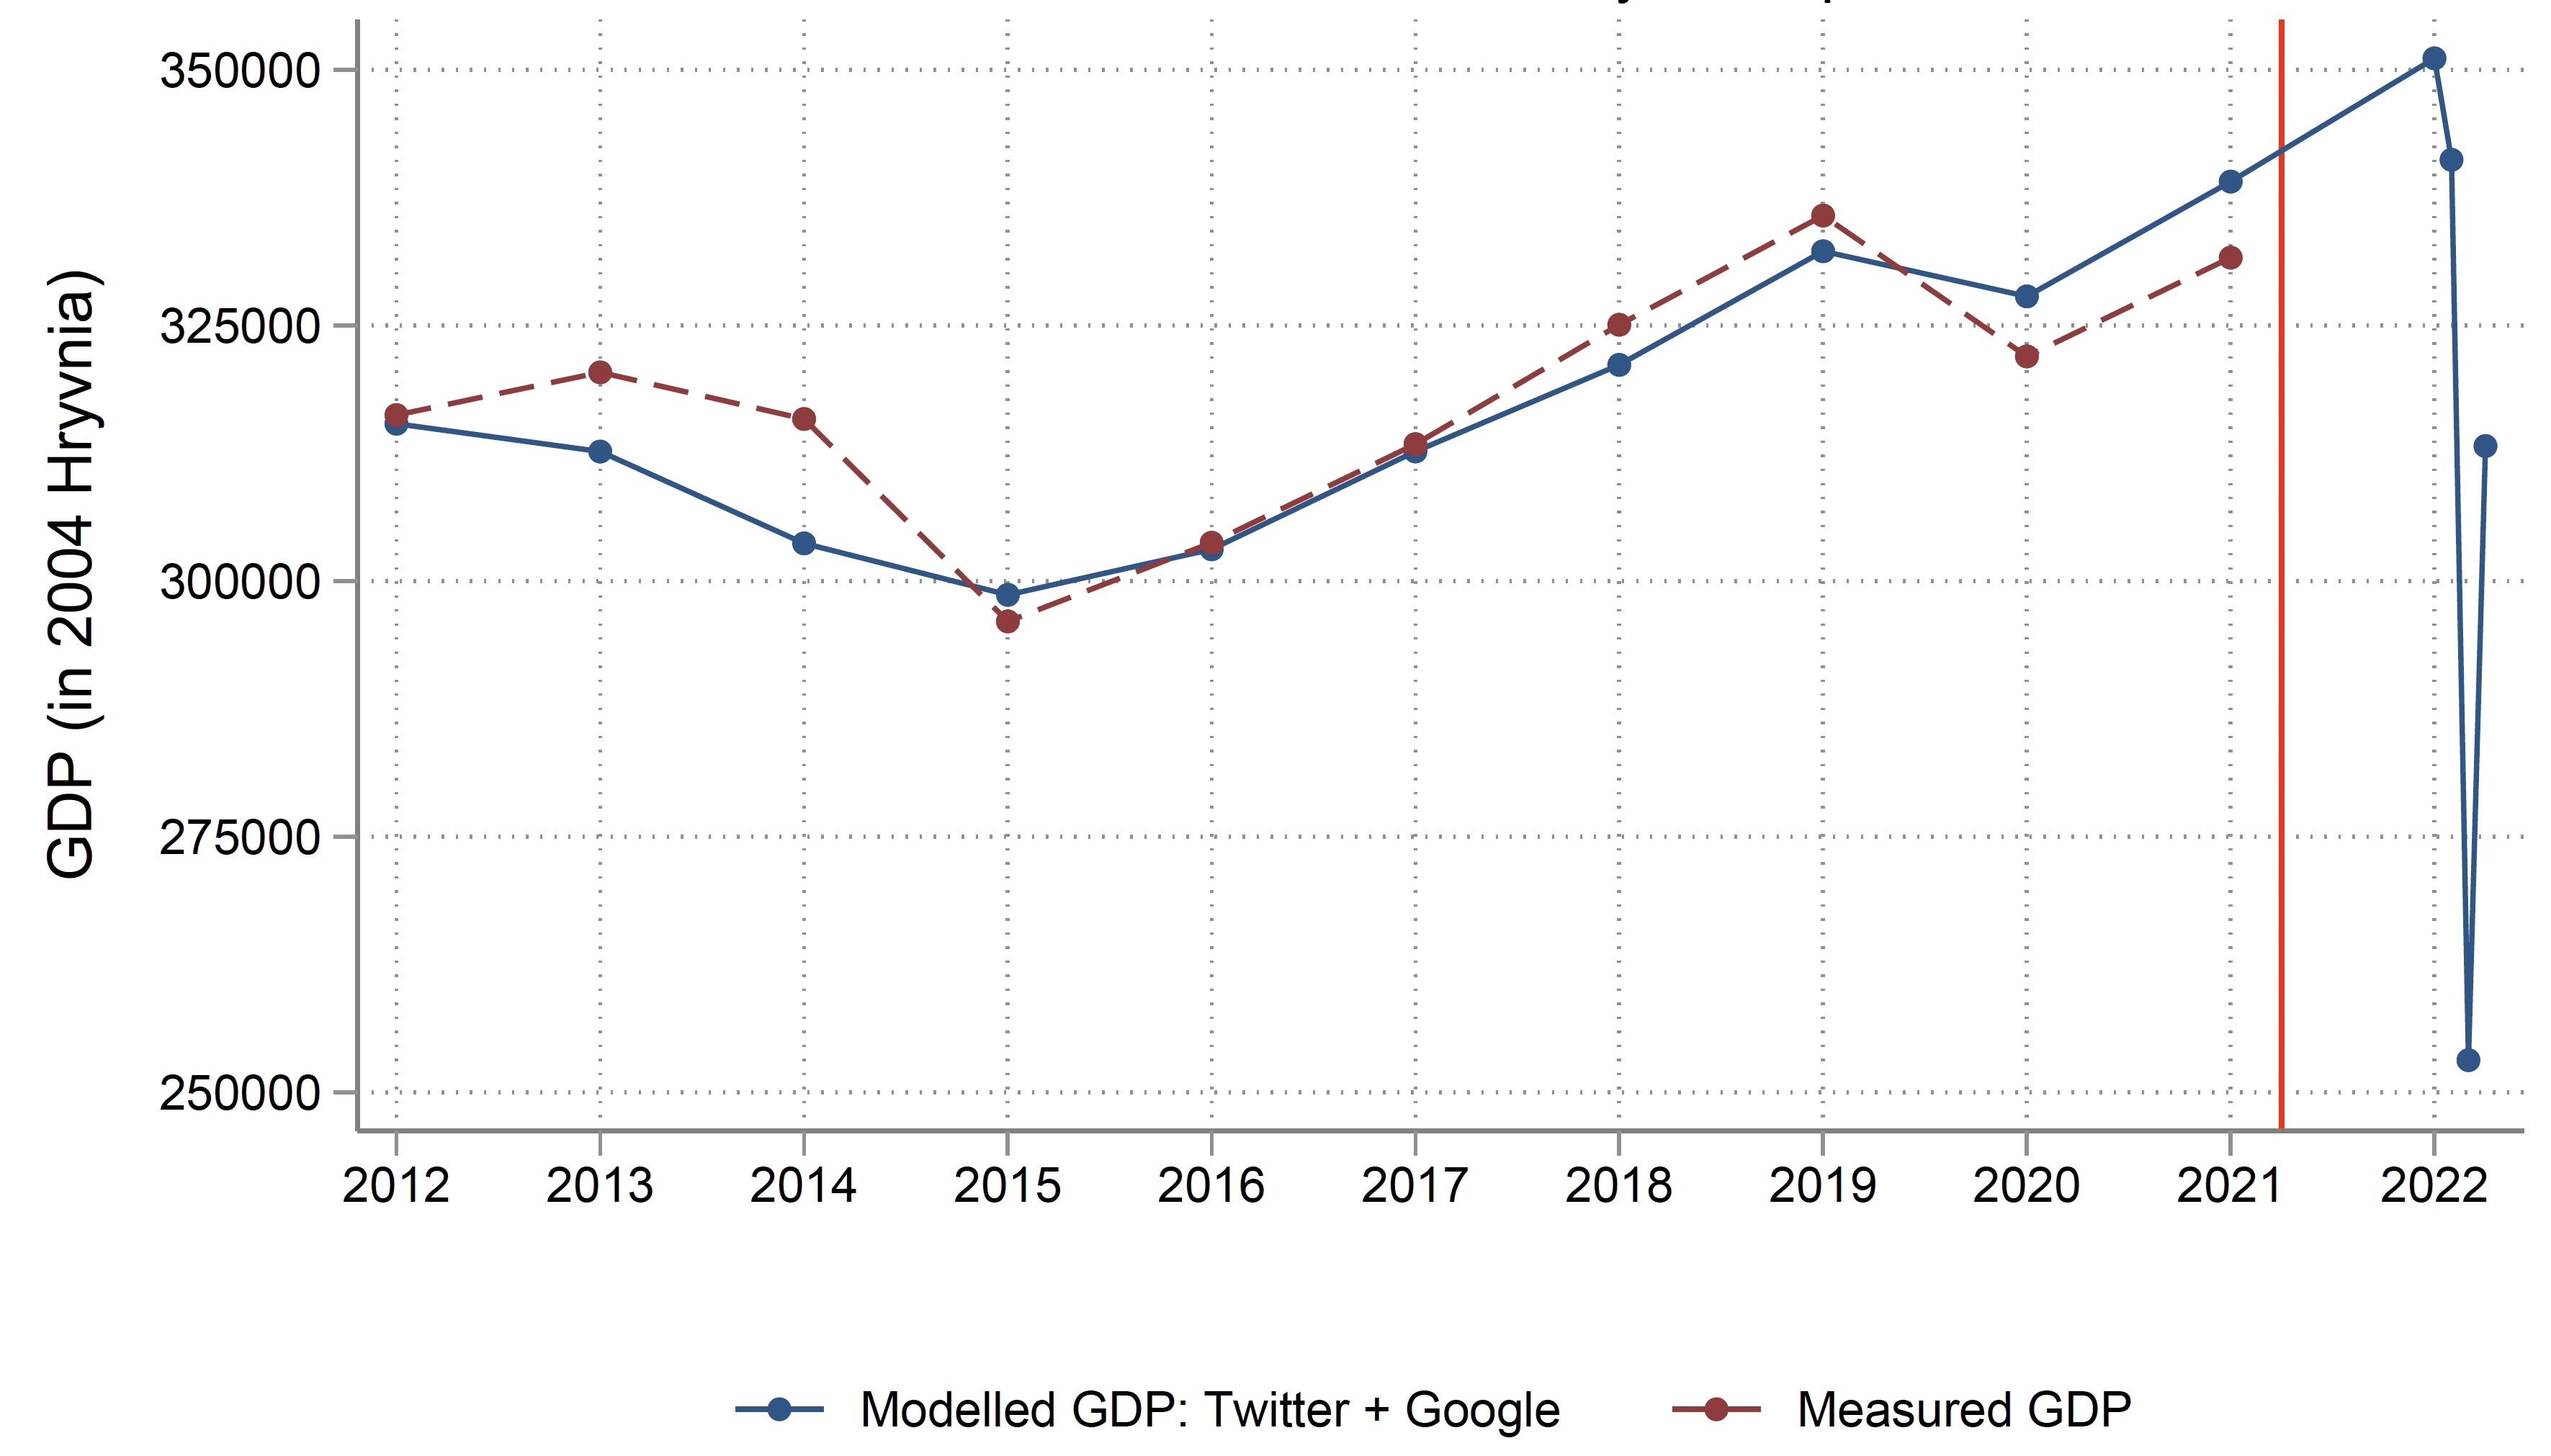
Figure 2 National real GDP of Ukraine: Annual 2012-2021 and monthly January-April 2022
Nightlights
Nightlights have been used successfully to estimate economic activity at both the national (Chen and Nordhaus 2011, Henderson et al. 2011, 2012) and subnational scale (Sutton et al. 2007, Doll et al. 2006). If light at night is a normal good, changes in its consumption reflect changes in income. Since light intensity can be measured from space on a regular basis, it is a popular tool with well-developed methodologies. The main concern with using this approach is that remotely sensed nightlights data can be affected by weather so they cannot be used reliably at very high frequency. During a war, lights at night may also be less reliable for several additional reasons. First, lights may be switched off to avoid being targeted.2 Second, fires resulting from enemy bombing are not reflecting economic activity while the smoke they generate may obscure other activity. Third, armed forces may be using lights strategically to mislead their adversaries. Although well-established, we consider this approach to be the least reliable for our work in this context and likely to underestimate economic activity during a war.
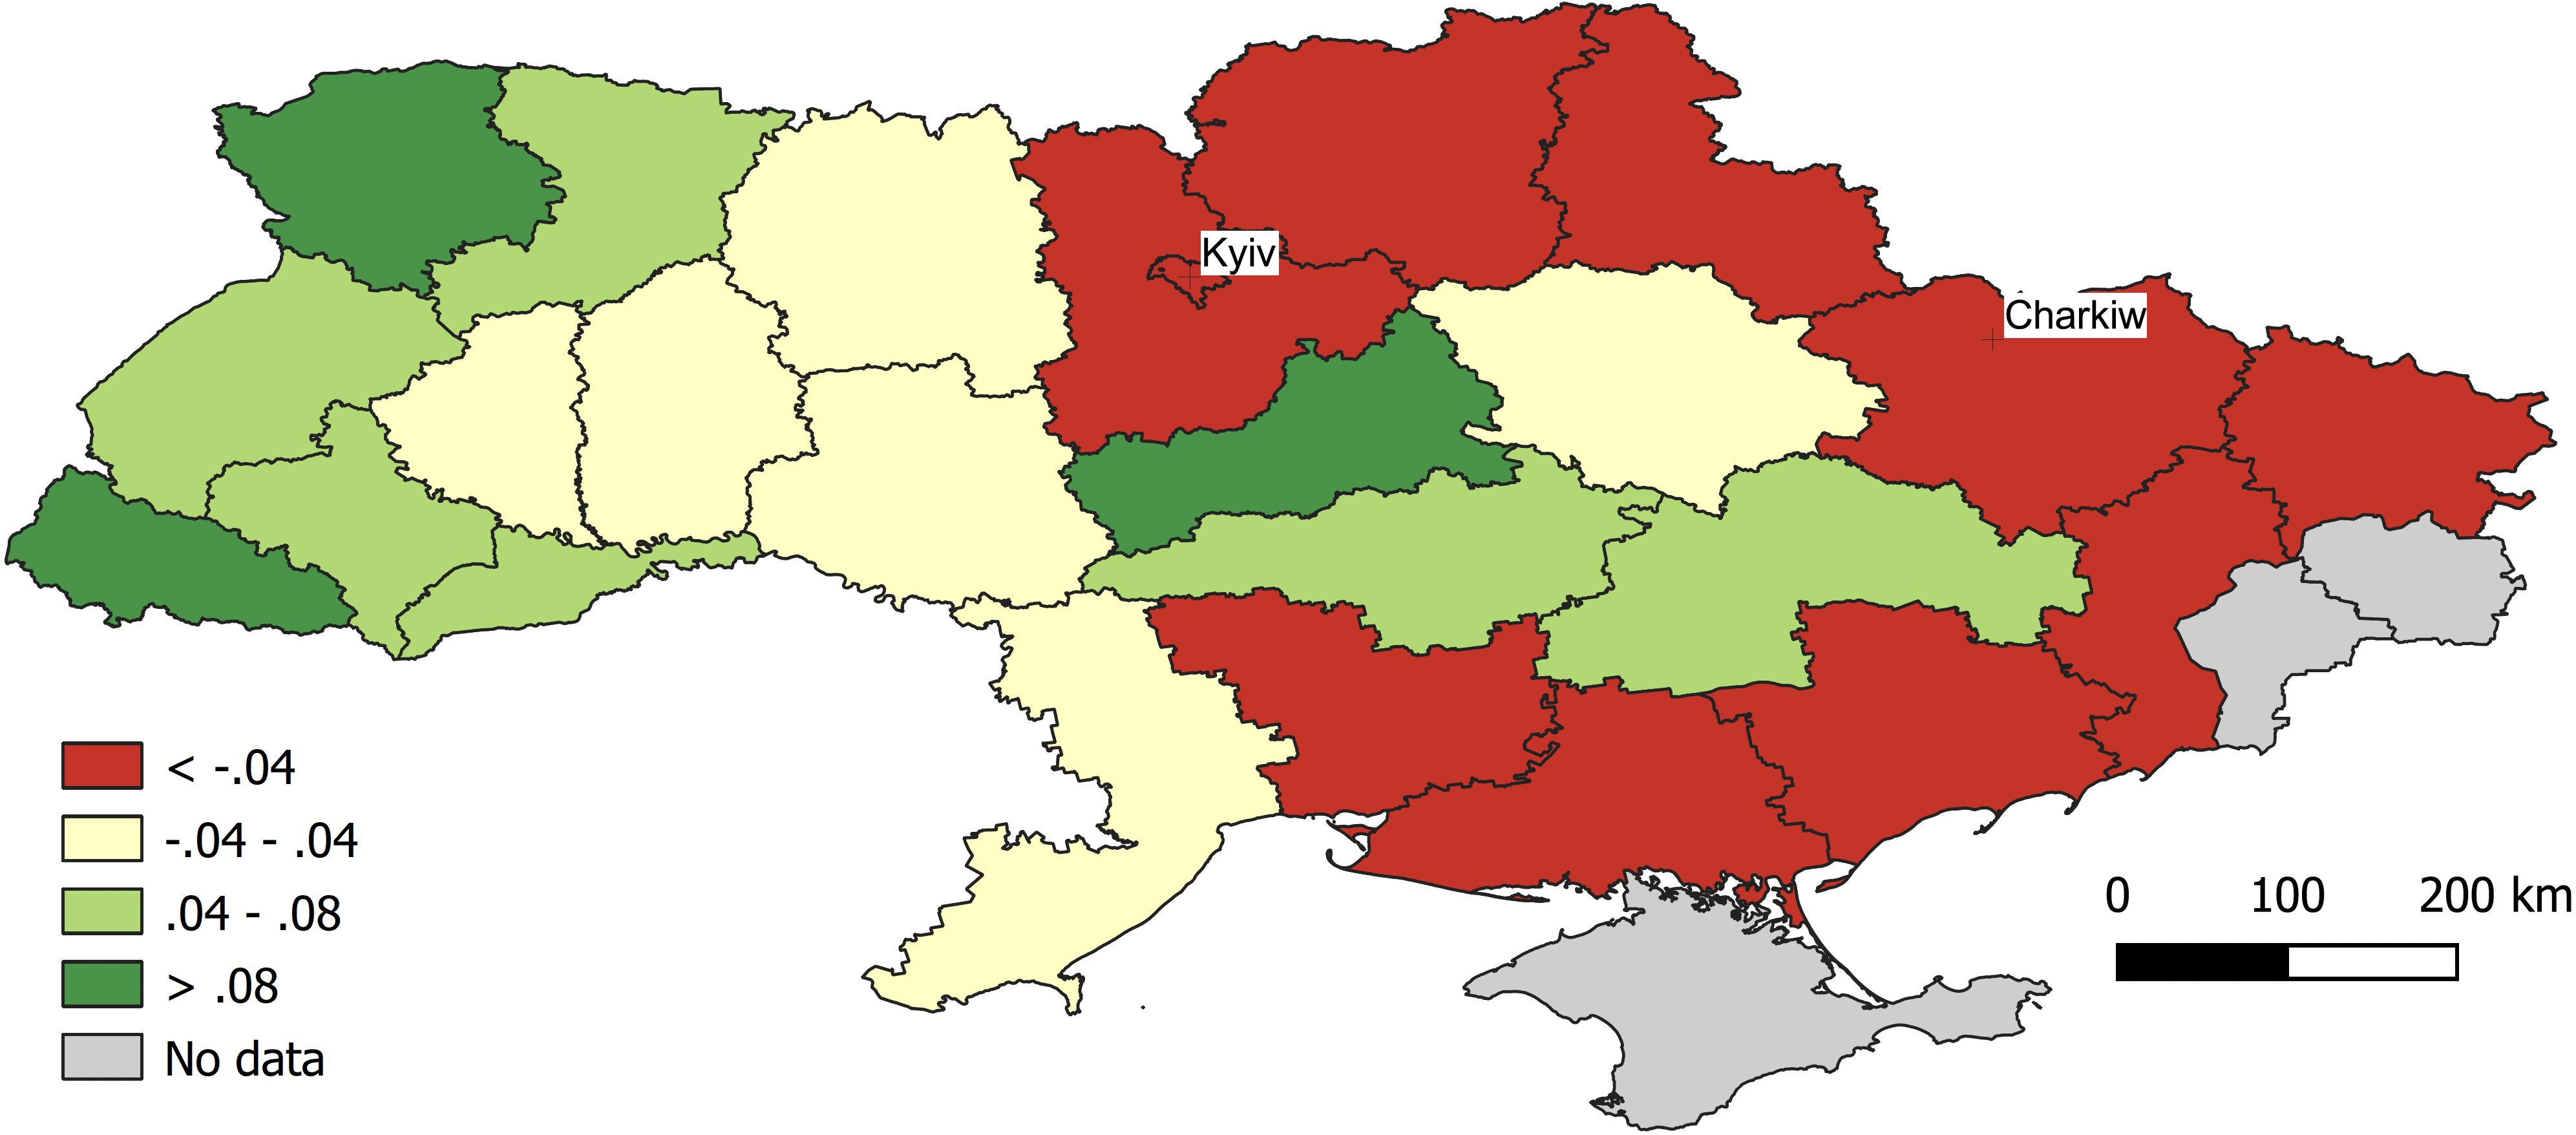
Figure 3 Real GDP changes between 2021 and March 2022
Google Trends
Ettredge et al. (2005) kickstarted, and Choi and Varian (2009) further established, the relevance of Google search engine data in nowcasting and near-term forecasting of a wide range of economic variables. Recent applications in nowcasting GDP at the national level are found in Goetz and Knetsch (2019). For any search term (or a group of terms such as ‘topic’ or ‘category’), Google reports the popularity of the requests it receives for this search compared to other searches, with a regional breakdown also available. An issue with this method is that it operates in shares rather than counts of searches. This means that during a war it could be biased by changes in the total number of searches.
Fleeting social media interactions act as a valuable GDP proxy in both cross-country applications as well as at finer geographic granularities as indicated in Indaco (2020) and Ortega-Bastida et al. (2021).
We use the count of Twitter posts that contain a picture and are geolocated to match Ukrainian oblast administrative boundaries. Oblast-level shares of Tweets (out of total Tweets) are positively associated with oblast-level GDP shares (out of national GDP), as shown in Figure 1. Users of Twitter use such posts to communicate conspicuous consumption so changes in this activity are highly correlated to changes in income and consumer trends. The advantage of this method is that, unlike Google trends, it responds to changes in local population.
Since pre-war Ukrainian regional GDP is measured annually, we are confined by the data to estimating our suite of models at an annual frequency. Model specifications are guided by the literature cited above. All values we report are adjusted for inflation and denominated in 2004 Hryvnia.
Economic Activity in 2022
Figure 2 shows data aggregated at the national level. It shows the measured GDP and in-sample predictions for 2012-2020 as well as out-of-sample predictions for 2021 and 2022 (data for 2022 is plotted monthly showing an annualised value for each month). The best in-sample performing model employs Google Trends and Twitter and tracks measured GDP closely before 2021. It also correctly predicts (out-of-sample) GDP growth in 2021 to be 3.5% (close to the value measured in data by the National Bank of Ukraine). Although monthly data for 2022 probably contain a lot of noise, they offer intuitive conclusions: economic activity experienced a dramatic shock in March (-45% compared to 2021) but rebounded in April (-15% compared to 2021). Adding nightlights and region fixed effects to our chosen specification makes little difference, but using nightlights alone suggests that economic activity decreased by around -40% between 2021 and April 2022 which is our lower-bound prediction. Overall, the changes have two sources: (1) changes in which areas are controlled by Ukraine, and (2) changes in activity in the controlled areas. Figure 3 shows changes in the economic activity that different regions contributed to the national total between 2021 and March 2022. In March, occupied regions made no contribution (in red), regions that were not directly affected (in yellow) contributed a little less than in 2021 but some central and western regions (in green) experienced higher levels of activity. Anecdotal evidence indicates that massive internal migration and temporary firm relocation likely account for any positive effects.
Figure 4 Daily GDP model: Google Trends
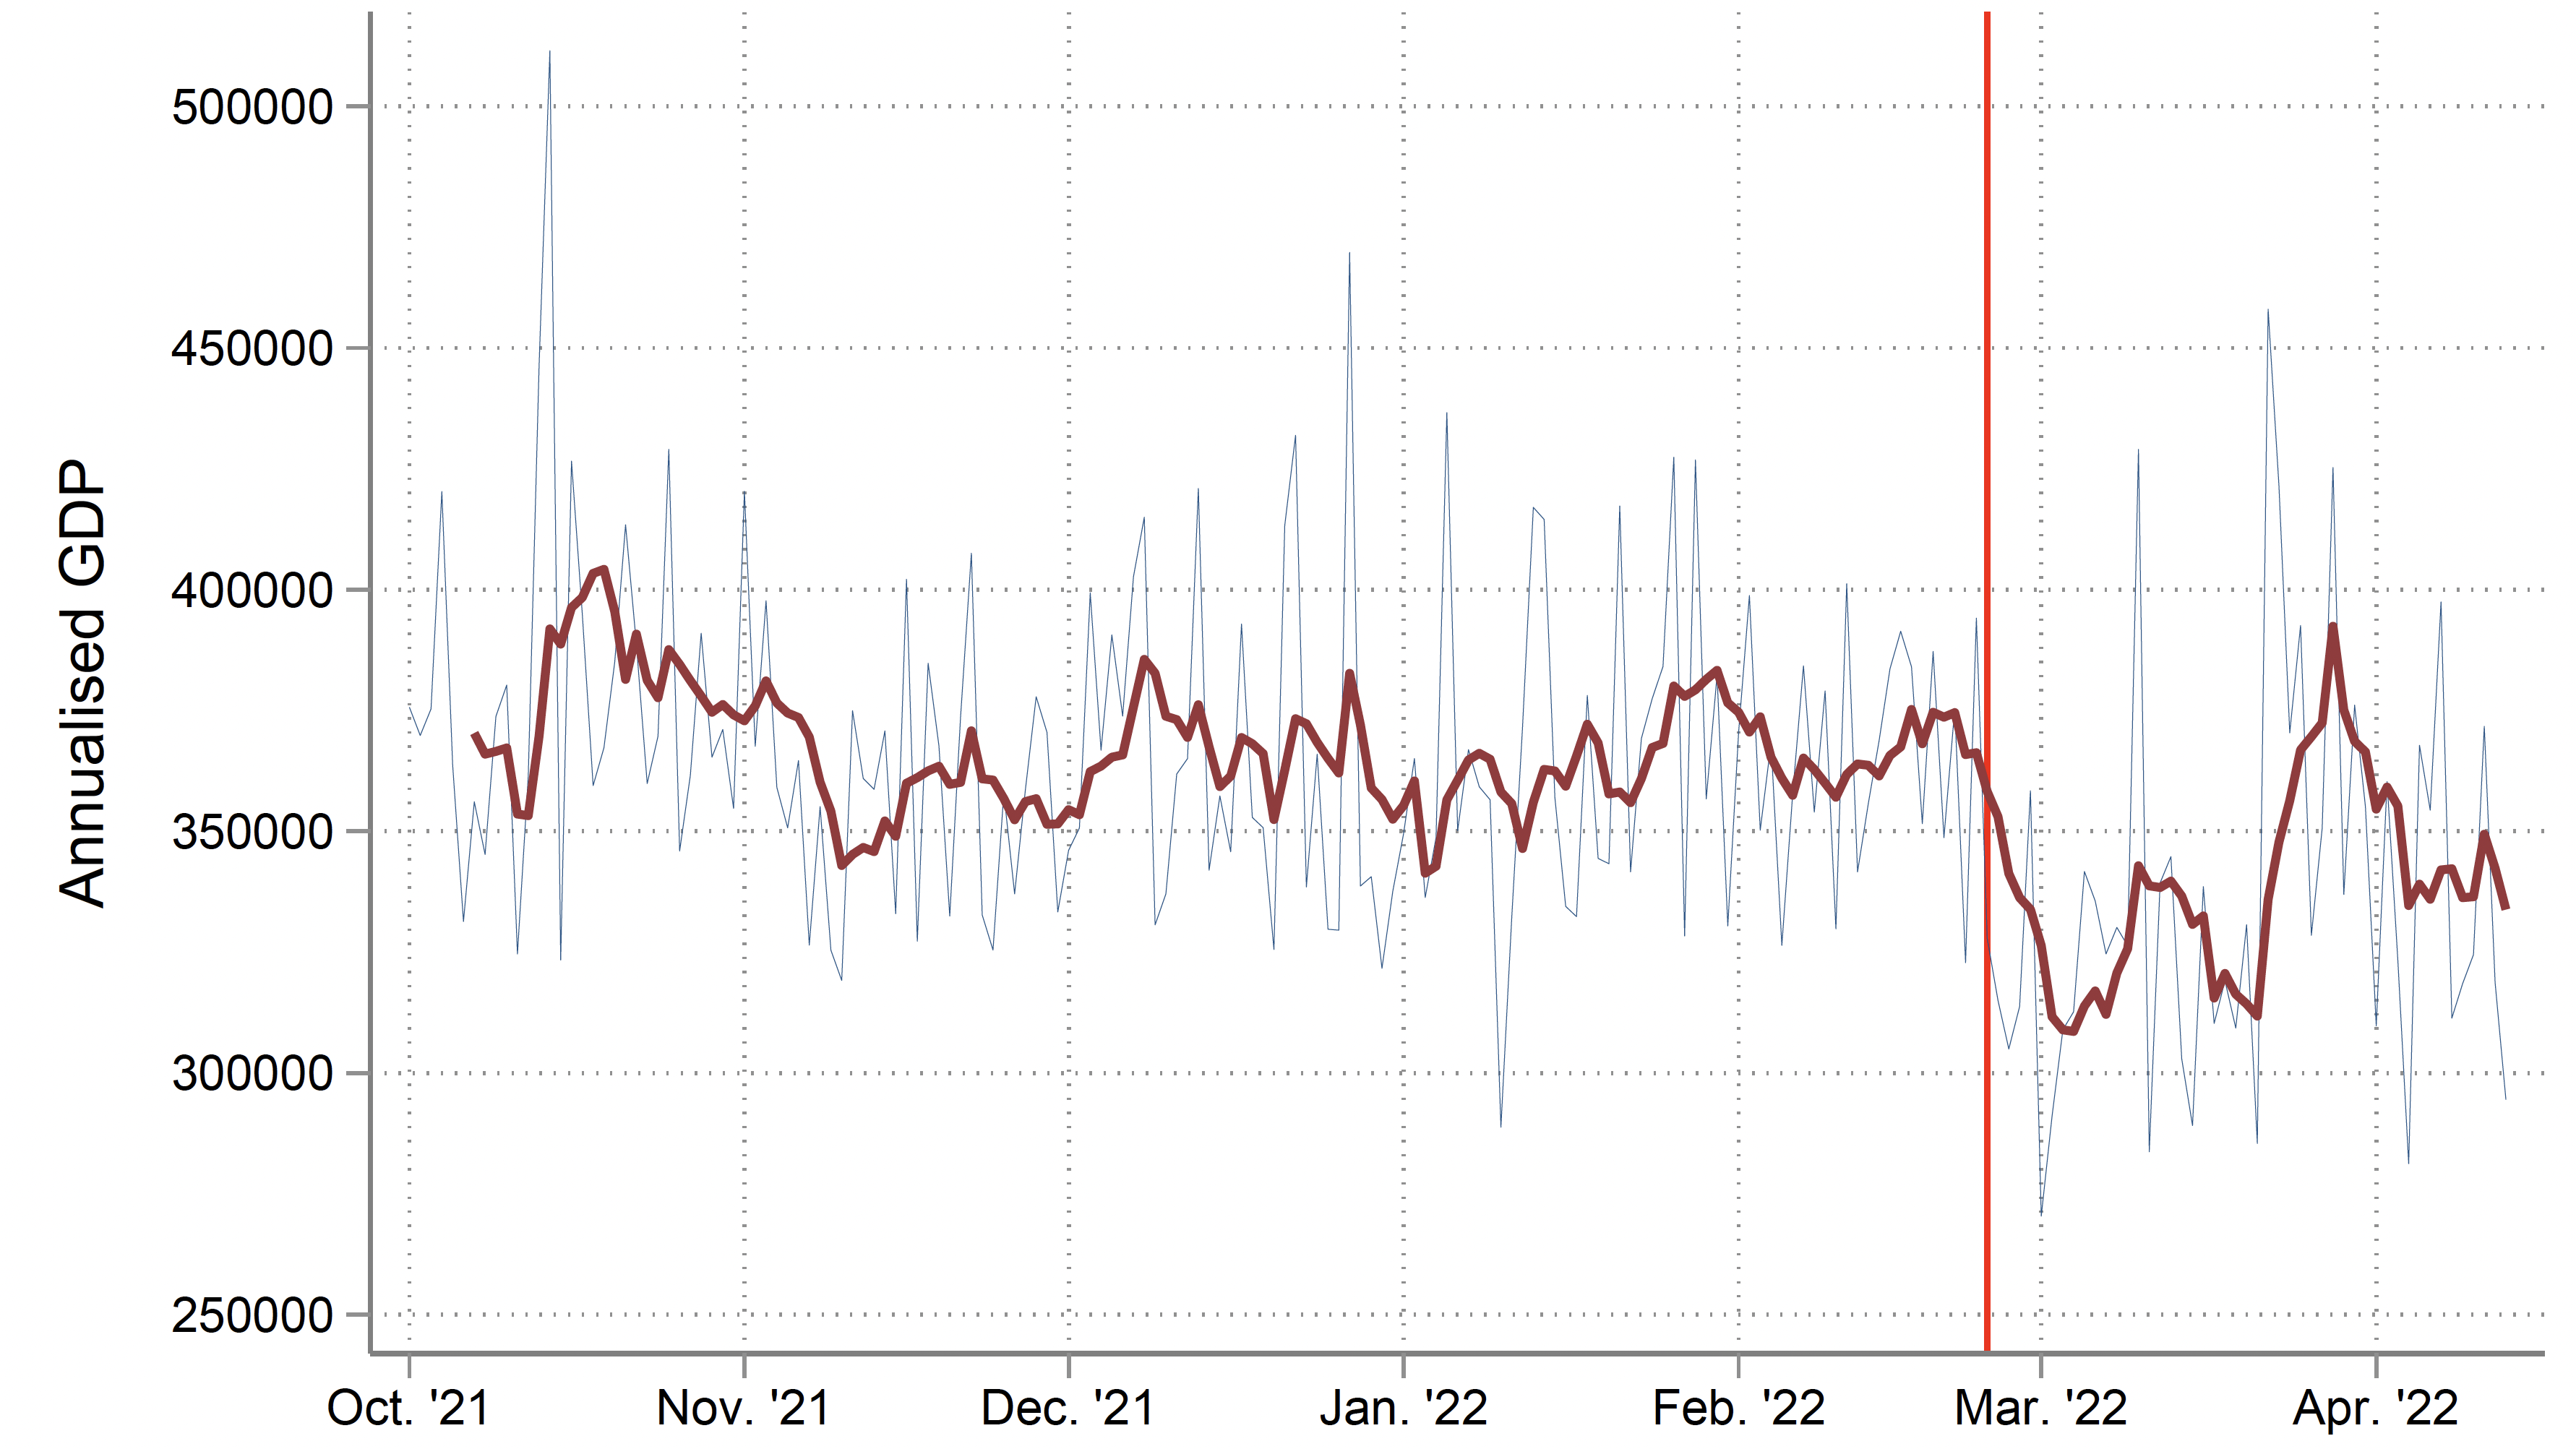
Our final figure uses only Google trends data but increases the frequency to daily observations (Figure 4 shows annualised daily GDP levels). Although the data are volatile, this exercise is useful in demonstrating two important points. First, it suggests that in the first days of the war, the level of economic activity reduced abruptly by around 40%. Second, at the end of March economic activity increased. At the beginning of April, it was at around 80% of the average level recorded in 2021. Further analysis shows that a large proportion of the increase at the end of March came from Kyiv City and Kyiv Oblast. As these two areas are critical for the nation’s GDP, winning the battle of Kyiv has had very important economic consequences. Our indicators also suggest that activity in areas occupied by Russia since 2014 increased before the invasion and remained elevated in 2022. We stress these results reflect the situation at the end of April 2022 and may change depending on how the war unfolds.
Authors’ note: The views expressed in this column are those of the authors and do not necessarily represent the views of the National Bank of Ukraine.
See original post for references


I can see the NYT headline now:
“Unconventional data indicates Uvalde killings increased US GDP by 2.74%”
One major problem is that a lot of real economic activities in Ukraine were off the books anyways (and a lot of reported activities never took place). Could anything like this be calculated with any reliability?
No, it can not be predicted with any reasonable degree of reliability or accuracy.
Yves’ introduction mentions some of the difficulties and her point about black market sales ( And not just of weapons) should IMO be emphasized.
Ukraine is and has been one of the most corrupt countries on Earth and the US has been pumping Billions of $ into it in the form of both weapons and cash.
The black market is a large part of the economy, 40% or more if it’s like Vietnam at the peak where half the goods shipped there were stolen off the docks.
GIGO, the data isn’t there.
And Putin has intentionally emigrated that corruption to the EU.
Fig. 2 does show a surprisingly good correlation between the measured GDP and internet derived model. I would expect the war to introduce many confounding factors but the basic pattern of a sudden fall and a rebound is not unexpected, after all weapon production, conscription, funerals will all add to GDP. The main problem is that GDP is not really a measure of economic health, merely activity.
Surely a strong correlation on the training data is kind of a given in a modelling exercise, since you’d chuck any model that didn’t correlate to the training data.
If I were hired to the do the job the authors are doing, then I’d next iterate through the models with reasonable correlation to the training data until we find one the makes the predictions the client wants to see.
A bounce and a rebound fits priors, so that’s cool. Not too low a dip though, because otherwise what’s the point in continued investment.
After years of producing statistics, forecasts, and historical data based on very little in the way of facts, they are now qualified to produce something from nothing!!
At this point, the Ukraine is now a failed State. It has lost its industrial regions, it’s food-growing regions, will soon lose access to the sea when the Russians roll up the coastline, has much of its workforce either in the army or fled to other countries, has a breakdown in law and order, is now virtually a one party State through the banning of any real opposition parties, its media is now under the thumb of the State, is dependent on overseas countries to pay their daily bills and… well you get the point. The real fun begins when this stupid war is over and the Ukraine has to see what it has left to work with. It won’t be much. It may be that it will have to depend on food aid from the EU and the UN. Taking a guess, I would guess a loss of 60-70% of its GDP.