Yves here. Economists’ debates over what caused our current inflation might seem academic. But getting the sources wrong leads to bad policies, which both can keep the imbalances going and inflict costs on the wrong parties.
Here, Servaas Storm focuses on how Ben Bernanke and Olivier Blanchard double down on using New Keynesian models, as opposed to data, to ‘splain what has been happening. The reason fixating on this approach is not just wrong-headed but damaging is that it seeks to perpetuate the traditional post World War II approach to inflation: have the Fed raise interest rates to whack demand so as to whack wages. This article (among other things) describes how despite business press hyperventilation about tight labor markets, wage increase were not a meaningful factor in this inflation. From the paper (emphasis original):
…the contribution to inflation of tight labor-market conditions—the main concern of many early critics of U.S. monetary and fiscal policies (Summers 2021; Blanchard 2021; Summers and Domash 2022)—was negative during the first two quarters of 2021 and positive but minuscule during 2021Q3-2023Q2.
By Servaas Storm, Senior Lecturer of Economics, Delft University of Technology. Originally published at the Institute of New Economic Thinking website
hree years have passed since inflation began its surge in Spring 2021, which continued until early 2023. As the inflation rate has since begun a hesitant decline, the time has come to look back at and reflect on what has happened during these challenging years. A recent evaluation of the causes of U.S. pandemic inflation comes from Ben Bernanke and Olivier Blanchard (2023), who (in their own words) use a simple dynamic model of wage-price determination to explain the sharp acceleration in U.S. inflation during 2021-2023. The Bernanke and Blanchard model analysis provides a representative specimen of the approach taken by establishment economists to the recent inflationary crisis, as it includes everything important that is problematic about New Keynesian macroeconomics.
Prominent central bankers, including Federal Reserve Chair Jerome Powell[1] and ECB President Christine Lagarde[2], take a rather different view when they state that their policy rate decisions, in these turbulent and uncertain times, are based on a data-driven approach, and not on standard macro models or monetary policy rules derived from these standard models. These central bankers are clear that standard macro models are of little use to them in the current macroeconomic environment that is particularly fluid economically and politically at domestic and global levels (Ferguson and Storm 2023).
Bernanke and Blanchard beg to disagree. With the benefit of hindsight, they present and estimate their simple dynamic model of prices, wages, and short-run and long-run inflation expectations which they claim closely tracks the pandemic-era inflation. Based on their analysis, Bernanke and Blanchard (2023, pp. 38-39) confidently conclude that “… we don’t think that the recent experience justifies throwing out existing models of wage-price dynamics.” The paper of Bernanke and Blanchard constitutes another contribution to – what I have elsewhere (Storm 2023a) – called the art of maintaining the New Keynesian paradigm. How convincing is the model analysis by Bernanke and Blanchard? How empirically relevant are their mechanisms causing inflation – and how robust and plausible are their econometric findings? In a new INET working paper, I answer these questions based on a critical review of the model analysis of Bernanke and Blanchard.
Bernanke and Blanchard’s (2023) Findings – But Put into Context
Bernanke and Blanchard’s answer to the question posed by the title of their paper (“What caused the U.S. pandemic inflation?”) is given in Figure 12, reproduced here as Figure 1. The figure shows the decomposition of the U.S. Consumer Price Index (CPI) inflation rate during the period 2020Q1-2023Q1, which is based on the estimated version of the dynamic model of the two authors. The quarterly CPI inflation rate, at annualized rates, is decomposed into the following three contributions: (1) initial conditions (which include the constant terms in the estimated equations as well as the exogenous rate of labor productivity growth); (2) supply-side shocks to energy and food prices and global supply chains that raise production costs; and (3) the job vacancy ratio 𝑣/𝑢, which captures the inflationary impact of tight labor market conditions.
The surge in the CPI inflation rate – from 2.8% in the fourth quarter of 2020 to a peak of 9.7% in the second quarter of 2022 – is overwhelmingly due to the supply-side shocks that raised production costs. This is not surprising, as this is exactly what any data-driven approach would also reveal. A visual inspection of Figure 1 suggests that supply-side shocks have been responsible for around two-thirds to three-fourths of the surge in the inflation rate during 2020Q4 and 2022Q2.
The contribution of ‘initial conditions’ to the U.S. inflation rate is found to be roughly constant over the period of analysis, at around 2 percentage points.
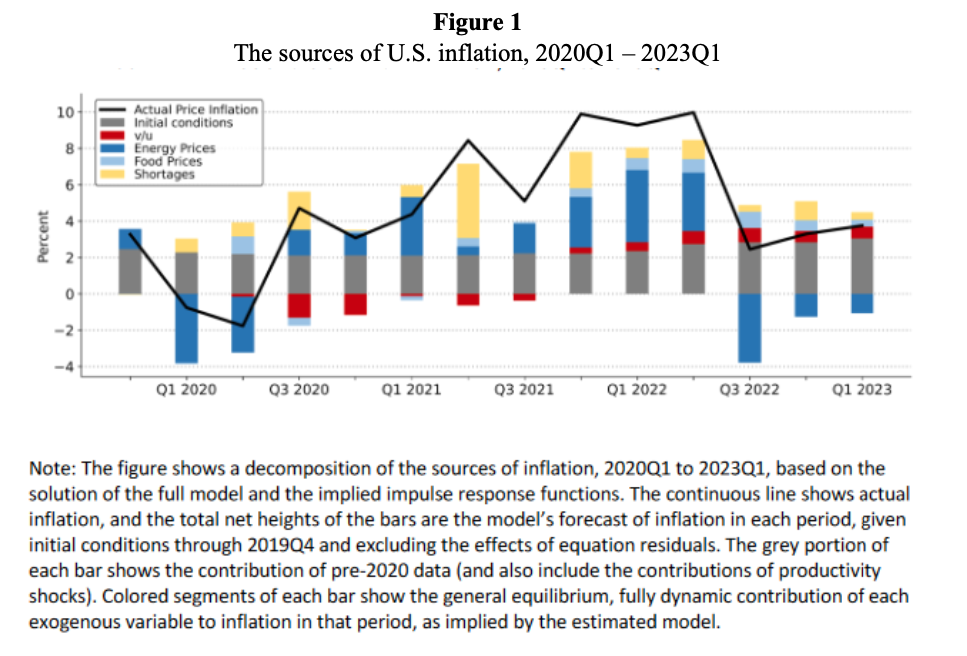
Finally, and importantly, the contribution to inflation of tight labor-market conditions—the main concern of many early critics of U.S. monetary and fiscal policies (Summers 2021; Blanchard 2021; Summers and Domash 2022)—was negative during the first two quarters of 2021 and positive but minuscule during 2021Q3-2023Q2.
This finding is striking because the U.S. labor market is supposed to have been ‘extremely tight’, even ‘red hot’, because the job vacancy ratio (the number of job openings per unemployed worker, or 𝑣/𝑢) rose to 1.9 job openings per unemployed worker in the second quarter of 2022 – a level considerably greater than in any earlier period since these data have been collected.
Reading between the lines, it is clear that Bernanke and Blanchard are unpleasantly surprised by the discovery that the ‘extremely high’ vacancy ratio during the post-pandemic period did not significantly contribute to the rise in the CPI inflation rate. The cognitive dissonance must be large. The reason is that their finding of a pitiful contribution of 𝑣/𝑢 to rising inflation does not fit the established narrative that the recent bout of inflation must have been caused by expansionary fiscal policies, leading to an overheated labor market and to a situation in which actual output exceeds the economy’s potential. In this omnipresent narrative, President Biden’s ‘excessive’ COVID relief spending and the even more ‘cavalier’ $1.9 trillion American Rescue Plan are commonly singled out to have stoked inflation by pushing actual output above potential and by overheating the labor market (Blanchard 2021; Summers 2021).
Contradicting this narrative, the Working Paper shows that the output gap of the U.S. economy hovered around zero during 2021Q1-2023Q4, right when the rate of CPI inflation began its surge. The (close to) zero output gap does not signal a structurally overheated American economy – and it is also not aligned with claims of a ‘red-hot’ labor market and a historically unprecedented job vacancy ratio of nearly 2.
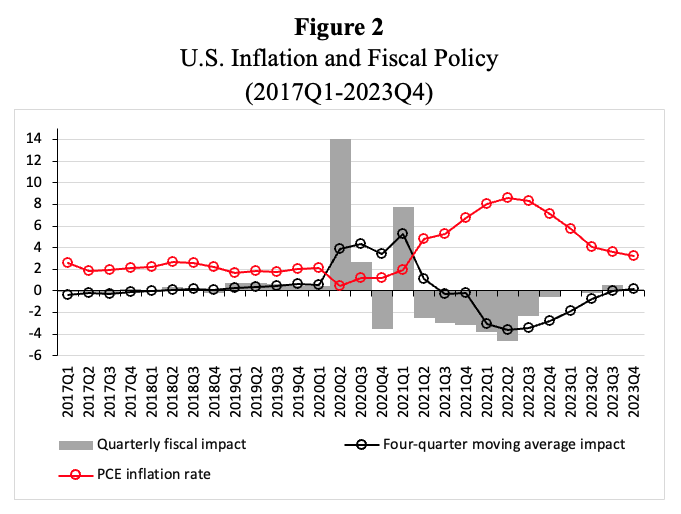
The established narrative blaming the inflation on the Biden relief spending during 2021 gets another blow when one considers Figure 2, which shows the contribution of the fiscal policy stance to real GDP growth during 2017Q1-2023Q4. It can be seen that the contribution of fiscal policy to real GDP growth has been negative during 2021Q2-2023Q3, amounting to —4.6% in the second quarter of 2022. During 2021Q2-2023Q3, fiscal policy has been a significant drain on economic growth. It is not plausible to attribute the surge in U.S. inflation to the de facto fiscal austerity of the Biden administration.
Finally, Figure 3 presents direct quarterly evidence of the relationship between the vacancy ratio and nominal wage growth for 53 years (1970Q1-2023Q4). Nominal wage growth is measured by the growth rate of hourly compensation of all workers in the U.S. non-farm business sector. The observations for the ‘tight-labor-market’ period 2021Q3-2023Q4 appear in red; the four observations for the year 2020 are in black. It is evident that the period 2021Q3-2023Q4 is historically unique when it concerns the level of the vacancy ratio, but is completely ordinary or average in terms of the growth rate of nominal earnings.
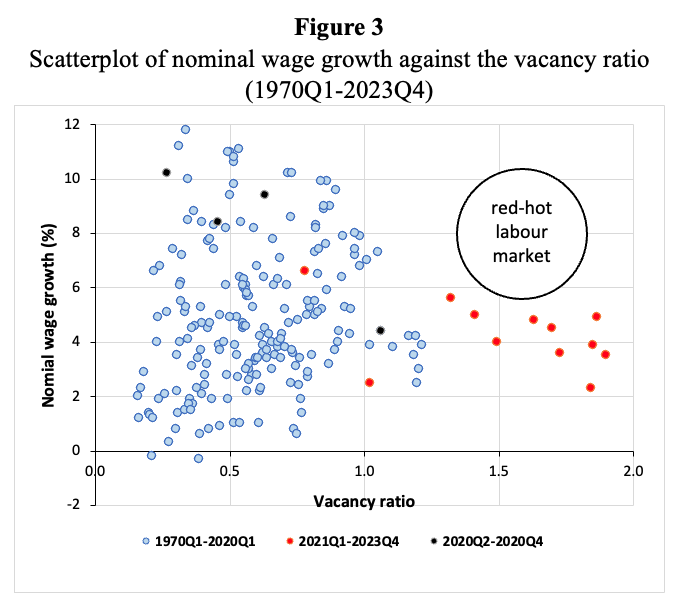
The extremely high vacancy ratio did, therefore, not lead to particularly high nominal wage growth – another inconvenient fact that contradicts claims of an operative wage-price inflation spiral.
But Bernanke and Blanchard do not give up. They conclude their paper by presenting model-based inflation projections for the period 2023Q1-2027Q1, based on three alternative (low, medium, and high) scenarios for 𝑣/𝑢. If 𝑣/𝑢 remains permanently at a level of 1.8 job openings per unemployed worker, inflation will remain high and well above the putative inflation target of 2%. This conclusion brings us into dangerous policy territory. Bernanke and Blanchard (2023, p.38) end by concluding that
“[A]s of early 2023, tight labor market conditions still accounted for a minority share of excess inflation. But according to our analysis, that share is likely to grow and will not subside on its own. The portion of inflation which traces its origin to overheating of labor markets can only be reversed by policy actions that bring labor demand and supply into better balance.”
Hence, the conclusion is that “labor-market balance should ultimately be the primary concern for central banks attempting to maintain price stability.” Monetary policy thus has to remain tight, because it has to create the extra unemployment that is necessary to bring down the 𝑣/𝑢 ratio, lower nominal wage growth and bring back inflation to 2%. However, the policy conclusions are only relevant when the model analysis is sound and credible.
The Wage-Price Spiral Model: A Critique
As is argued in the Working Paper, the econometric findings of Bernanke and Blanchard must be taken with a few pinches of salt. Leaving aside questions concerning the rather eccentric econometrics underlying the model analysis, it is important to note that Bernanke and Blanchard’s estimate of the impact of an increase in the job vacancy ratio on nominal wage growth considerably exaggerates the inflationary effects of a tight labor market, as it is more than twice as large as other, more reliable estimates of the same effect in the literature. Despite this ‘bias’ in favor of wage-push inflation, Bernanke and Blanchard find that (exogenous) supply-side shocks have been responsible for around two-thirds to three-fourths of the surge in the inflation rate during 2020Q4 and 2022Q2, while the contribution to inflation of tight labor-market conditions was negative during the first two quarters of 2021 and positive but minuscule during 2021Q3-2023Q2 (Figure 1).
However, more important than the weak econometrics are major concerns with respect to the internal logic of the simple dynamic New Keynesian model that Bernanke and Blanchard employ to identify the causes of the U.S. pandemic-era inflation. Two issues stand out.
First, it is claimed that a permanently tighter labor market leads to permanently higher inflation. This sounds very dangerous, but the outcome of permanently rising inflation is based on the non-plausible inflation-expectations channel, formalized by Bernanke and Blanchard, that does not survive a confrontation with economic reality and empirical evidence. This inflation expectations channel is based on two contradictory (and equally unrealistic) assumptions. On the one hand, U.S. workers are assumed to possess the bargaining power to force firms to pay nominal wage increases in line with increases in short-run expected inflation. This presupposes a worker wage bargaining power that palpably does not exist (Stansbury and Summers 2020).
On the other hand, these powerful, forward-looking workers do not strongly ratchet up their inflation expectations in the face of a sudden surge in actual inflation, because their inflation expectations are well-anchored in the belief that the Federal Reserve will quickly and effectively bring inflation down to its target. As a result, inflation expectations permanently fall short of actual inflation, which is – in this model – a reason why the acceleration of inflation is happening in slow-motion; it takes many years before the Phillips curve becomes vertical, but, as we all know, “The long run is a misleading guide to current affairs. In the long run we are all dead,” as John Maynard Keynes wrote in his 1923 work, A Tract on Monetary Reform.
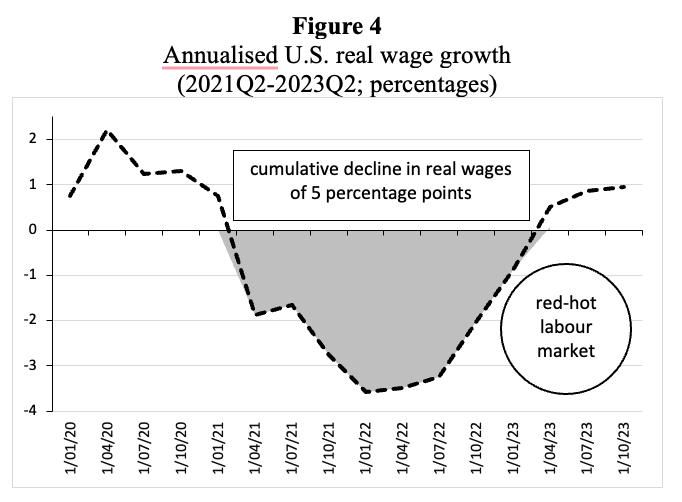
It is a mystery why Bernanke and Blanchard assume that American workers are able to raise wages in line with expected inflation and at the same time are gullible enough to believe that the Fed’s inflation targeting is credible. It is not, because the effects of monetary tightening on inflation are limited and take time to build, with the result that workers will have to go through a prolonged period of real wage declines. As is shown in Figure 4, because nominal wage growth fell short of the CPI inflation rate during 2021Q2-2023Q2, workers had to swallow a cumulative real wage decline of around 5 percentage points. Permit me to repeat the obvious point that this is exactly the period during which the U.S. labor market is supposed to have been ‘red hot’, with a job vacancy ratio of almost 2 job openings per unemployed worker.
Bernanke and Blanchard argue that the prolonged decline in real wages has been caused by unanticipated supply shocks that raised costs and, hence, prices. Workers, in their view, behaved rationally by putting faith in the Fed’s ability to control inflation, because the inflationary outcome would have been far worse if they had done otherwise. After all, if American workers had decided to claim higher nominal wage growth in response to the sudden supply-side-driven surge in inflation, inflation expectations would have become un-anchored, and the inflation rate would have accelerated more and faster. Thank goodness, American workers are real patriots who know what has to be done during a national emergency: keep trust in the brave inflation fighters of the Federal Reserve.
This leads us to a second, even bigger problem in Bernanke and Blanchard’s model: Bernanke and Blanchard assume that American workers have wage bargaining power, which they use to protect their real wages. In the model’s steady state, real wage growth equals (exogenous) labor productivity growth. This is not a bug, but a feature of their model, behind which the economic reality – for ages, real wages have failed to keep up with labor productivity growth, and the labor income share is in secular decline – has been hidden. Figure 5 illustrates the point.
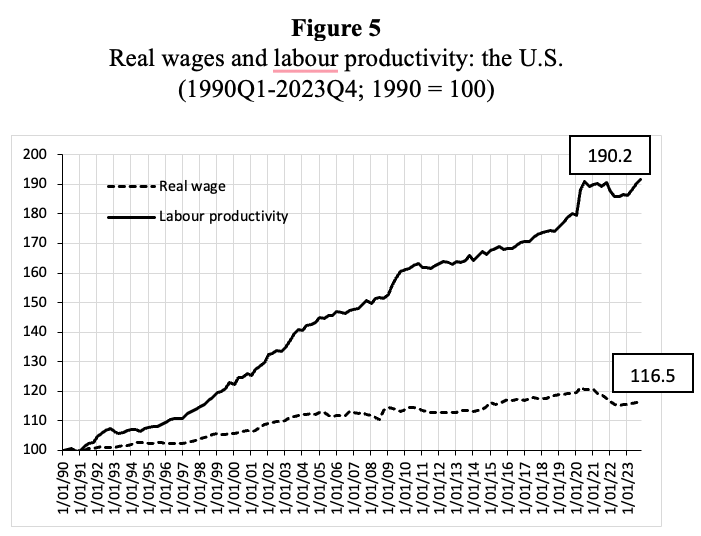
Hence, U.S. real wages are not downwardly rigid but rather have been falling relative to labor productivity. Rather than being a source of inflationary pressure, real wages have acted as an absorber of inflationary shocks. By building real-wage rigidity into their model, through the inflation-expectations channel, Bernanke and Blanchard again exaggerate the inflationary consequences of a tight labor market and of cost shocks. Their model analysis is biased, designed to demonstrate the supposedly Very Serious Inflationary Consequences of an exaggerated tightness of the labor market, setting monetary policymakers up to deliver significantly more monetary tightening than can be justified on the basis of alternative and arguably more realistic model analyses (e.g., Fair 2021, 2022).
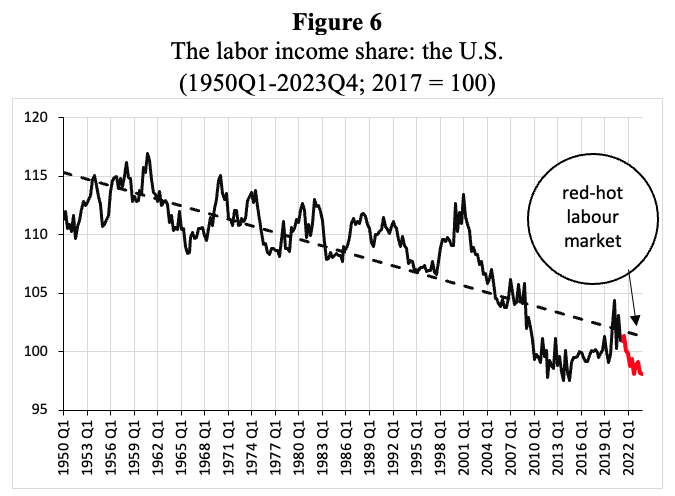
In doing so, Bernanke and Blanchard manage to ignore the single most important stylized fact on the post-1980 U.S. economy: the secular decline in the labor income share (Figure 6). The declining labor income share is a direct consequence of the decline in worker (union) power (Stansbury and Summers 2020), which, in turn, is consistent with another salient aspect of the macroeconomic experience of the U.S. in recent decades: the substantial decline in both unemployment and inflation, reflected in the flattening of the price Phillips curve (Storm 2023a).
Bernanke and Blanchard overlook, or refuse to consider, the fact that worker power has dwindled in the U.S., as many men and women had to go from stable, decently paying jobs in factories and stores to insecure work in the gig or services economy – and the decline of private-sector unions has resulted in the near-monopoly of political lobbying about private sector economic issues by corporate and shareholder interests, influencing Democrats and Republicans alike. Likewise, Bernanke and Blanchard do not wish to entertain the possibility that some of the inflation surge during 2021Q2-2023Q4 must be attributed to increases in corporate profit markups (Storm 2023b) and speculation in oil and energy markets (Breman and Storm 2023). These are errors of commission, not omission, and they are not neutral, but provide an apologetics for an unequal, unjust, oppressive, and politically unstable social order (Rudd 2022).
It is not surprising, therefore, that the Federal Reserve and other central banks use a data-driven approach to their monetary policy decisions. The established New Keynesian models are of no use. The state of macro is not good.
_____________
[1] For example, at a press conference on July 26, 2023, Powell (2023) said, “Looking ahead, we will continue to take a data-dependent approach in determining the extent of additional policy firming that may be appropriate.”
[2] According to Lagarde (2023), President of the European Central Bank, the “elevated level of uncertainty reinforces the importance of a data-dependent approach to our policy rate decisions, which will be determined by our assessment of the inflation outlook in light of the incoming economic and financial data, the dynamics of underlying inflation, and the strength of monetary policy transmission.”
See original post for references


The aristocrats are always punching down on the peasantry …
https://fred.stlouisfed.org/graph/?g=1jczi
January 30, 2018
Labor Share of Nonfarm Business Income and Real After-Tax Corporate Profits, 2000-2023
(Indexed to 2000)
Decline in labor share of income:
87.2 – 100 = – 12.8%
Increase in real profits:
256.8 – 100 = 156.8%
https://fred.stlouisfed.org/graph/?g=EqSq
January 30, 2018
Labor Share of Nonfarm Business Income and Real After-Tax Corporate Profits, 2017-2023
(Indexed to 2017)
Decline in labor share of income:
98.6 – 100 = – 1.4%
Increase in real profits:
116.1 – 100 = 16.1%
When your answer to rising prices is to try to increase unemployment, your “model” is morally wrong. When your answer to rising prices is to make things more expensive by raising interest rates, your “model” is mathematically wrong. Eventually, things will trend back to “normal” and they will congratulate themselves that they are so smart.
Home prices were skyrocketing due to institutional investors taking advantage of historically low interest rates, but now we have high home prices AND high interest rates and personal home ownership is at even lower levels. Prices of goods haven’t gone down, they just stopped going up as quickly. You can’t put the genie back in the bottle, but you can certainly keep making things worse.
For economists such as B&B, there is a simple solution. All they need to do is add wars and pandemics (and money and banks and inequality) to their inflation models and they should be good to go.
/sarc
It’s weird. It’s like they are trying to superimpose industrial economy supply-demand theories onto a services/ rentier economy. No?
I have done back of the envelope calculations several times in the past decade. Currently, it would be roughly $31.00 per hour today to barely match the lifestyle of my parents living on the minimum of $1.60 in 1968. Of course, that does not count the food stamps that we also got. This was in the Santa Clara Valley as it was changing into Silicon Valley.
Today, I get $23 in SNAP because I get too much in disability income income and in kind help from my family. If I didn’t get both, I would be homeless, but I am just below the poverty income limit to qualify for Medi-Cal. Something is wrong in the state and federal calculations when determining poverty and need.
I can reread this post, but honestly, I do not see how these experts can crunch the numbers (and look outside the window in most places in America) and believe in this “red hot market” or in the wages of being too high for anyone in the bottom half of the population, which would include the lower middle class. Forget “cognitive dissonance,” willful ignorance or blindness seems more accurate.
This is more evidence of the general incompetence of our ruling elites and the Professional and Managerial Caste that serve them.