Yves here. The Angry Bear post below called a recession watch, but yours truly is upgrading it to a stagflation watch. That is due the fact that inflation persists and Trump tariff effects set to start kicking in over the next few months means relief is not likely….at least until the economy gets a lot weaker. And keep further in mind that we are seeing this slide in activity despite the Federal government continuing to engage in “net spending” as in running large deficits that should be goosing activity.
By New Deal democrat. Originally published at Angry Bear
“Recession Watch” instituted for US economy, as economically weighted ISM indexes indicate present contraction
Two months ago, in response to the new orders components of the economically weighted ISM manufacturing and services indexes, I hoisted a yellow flag “Recession Watch.” That continued last month as well.
This month the economically weighted headline numbers tipped into contraction as well. Together with other negative readings in the goods-producing sector of the economy and flagging if still positive services indicators, the yellow flag now transitions into a red flag “recession watch” for the economy as a whole.
Let’s start with this morning’s crucial report.
According to ISM, in July the services sector of the US economy grew at the lowest increment possible, just 0.1 over the balance point at 50.1. The more leading new orders component also grew just slightly at 50.3.
To recap, because manufacturing is much less important to the economy than in the decades before the Millennium, the economically weighted average of the ISM services index (75%) as well as manufacturing (25%), especially over a three month period (to cut down on noise), has been much more accurate since 2000.
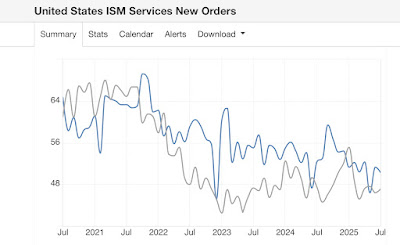
Starting with new orders, the previous two months came in at 51.3 and 46.4, giving us at three-month average of 49.3. As I reported yesterday, the three-month average for manufacturing new orders was 47.0. Here are what both look like [Note: all graphs from TradingEconomics.com. Blue is services, gray is manufacturing]:

The three month economically weighted average for new orders is 48.8, indicating contraction, just as it has for the previous two months.
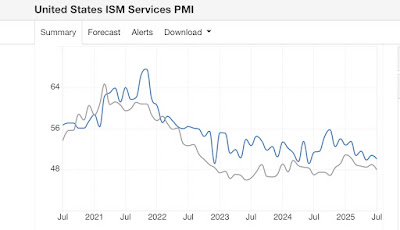
The difference this month is that contraction has spread to the headline numbers as well. The previous two months for the service sector were 50.8 and 49.9, making the three month average 49.1. Yesteday the three month average for the manufacturing sector was 48.5. Here is that graph:

As a result, the economically weighted three month average for the headline indexes is 49.1. This has tipped the entirety of the indexes into not just leading but *present* contraction.
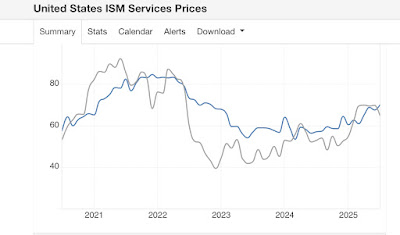
Before I conclude, what happened with the prices paid component is also noteworthy. The prices paid component clocked in at 69.9, a 2.5 year high, as is the three-month average. As the below graph shows, the prices paid component of the manufacturing index has also made 3-year highs, although it backed off in July:

In short, what the ISM manufacturing and services indexes together tell us is that we have accelerating inflation, manufacturing contraction, and services just treading water. Or, in other words, stagflation.
Two months ago I concluded with the statement: “In the meantime, watch to see if the remaining short leading indicators to fall into place, most notably new jobless claims, consumer retail spending, employment in the goods-producing sectors, at very least a stalling in aggregate real payroll growth.” With the exception of new jobless claims, all of these have either stalled or contracted.
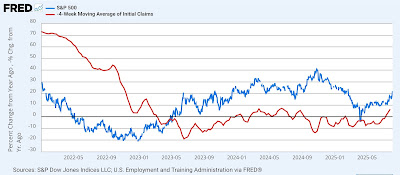
As I’ve said in the past two months, treat the terms “watch” and “warning” the way you would for weather. A “watch” means that conditions are right, and the economy is at significantly heightened risk of a recession starting in the next few months. A “warning” would mean that a recession is likely, and almost imminently. A “recession watch” for the US economy is now amply justified. Almost the only reason for not upgrading to a “warning” already is the below graph:

With rare exception, before a recession begins stock prices peak and turn down, while initial jobless claims turn up by 10% or more YoY. In addition to the above, I really think we need one more month of data to see if the recent downturn in real consumer spending is just payback for the previous front-running of tariffs, or whether it is a more durable trend.
But to reiterate, consider this the initiation of a “Recession Watch” for the US economy as a whole.


Following the model they have imposed on S American nations.
Not so much a Democracy!
So sad to see the promise squandered.
I think that the only way that Trump will fight these trends is to impose total narrative control over the figures coming out of the US government. We saw how this played out recently with unemployment numbers and maybe the Trump Cabinet is realizing that at the current rate, that they are going to run out of runway space well before next year’s midterms.
LOL. “… narrative control over the figures”.
That is a polite way of saying future numbers will be whatever our dear leader says they are.
On stocks, it is worth noting that the S&P 500 is driven hugely by the “mag 7” theses days, and they’re being driven by the AI bubble and a flight to safety/return. I wish I had access to more pertinent stuff, like 52 week stock new highs vs. lows and 4-week cumulative volume, but this stuff seems to be available only from very expensive market research services. NDR comes to mind. Oh well.
I quick google search gave me the following chart posted at reddit. I cannot confirm or deny it’s authenticity, but the shape seems correct.
https://www.reddit.com/r/EconomyCharts/comments/1l5gz41/if_you_net_out_the_mag_7_from_the_sp_500_the/
We posted grim detail from Ed Zitron on how dodgy the valuations are in this piece:
https://www.nakedcapitalism.com/2025/07/how-much-longer-can-we-trust-our-economic-statistics.html
“….but yours truly is upgrading it to a stagflation watch. That is due the fact that inflation persists and Trump tariff effects set to start kicking in over the next few months means relief is not likely….at least until the economy gets a lot weaker. ”
True dat– although I am skeptical any of it results in relief? Recession, deflation, or stagflation— the economy getting a lot weaker… none of that is good for the working poor. The hurt — like the wealth—is not evenly distributed.
The net effect will be the recession-proof will be presented with another pennies**-on-the dollar buying binge opportunity, as the poor struggle more, the in-between wannabes will be exposed as being nekkid as a jaybird. Wealth and property aggregation will continue at its accelerating pace.
Feature, not a bug. S L I C C.
Nekkid Capitalism?
**RIP Pennies
If you kick the economy stone cold dead enough, as Volcker did in the early 1980s, you will kill inflation. But the current inflation, even if painful to many because it comes off a high base for essentials like food and medical care, is not as severe or entrenched as the 1970s inflation.
I remember the Volker era. Graduated college into the post-Carter early Reagan ‘doldrums’. Actually saw Volker in a local fly shop, stogie in hand, picking out flies for the day for a day of fishing with with a Guide- this during ‘the throes of his tightening. Luckily I had a few pennies sitting in a money market that was paying out 17%- needless to say I had time to fish (no guide, PB n J), as I couldn’t find ‘real’ work.
That was a tough time. I do recall real estate values retrenching ever so slightly- it was more flat-lined, certainly not increasing, and Adjustable Rate Mortgages became the New Big Thing.
I do not recall food and energy (who needs them?) retrenching. Seems like one might kill inflation, might force a retrenchment in wages paid as people clamor for work in the race to the bottom, but price retrenchment for goods and services is slow- if ever- happening.
Interest rate rises- rocket ship up, inclined plane down.
There were 1/2 as many people on the earth- I can’t help but think there is an inflationary effect competing for resources on a finite orb.
Also, it seems that post-Volker, the clever folks on Wall Street and the Big Banks figured out a whole new array of financial products, tools, and machinations that create all sorts of ‘money’ and assets… all on paper, but a lot of buying power to drive up prices of limited assets. Bubble-icious!
I can’t believe Volker was swatting at nearly the number of blood-sucking targets back then as we since have created? All that ‘money’ dispassionately running around the world at the speed of light, seeking return.
Is Powell equipped with a large-headed swatter?
Empty punchbowl, music stopping, and not nearly enough chairs.
Will we be Turning Japanese, unfathomable national debt, ZIRP forever, and 150-year term Mortgages?
Dick Cheney may have told Pat Lahey to go eff himself, but Cheney also mentioned that ‘deficits don’t matter’
Political Will, Political Won’t, and some very perverse folks in power running the “No Lives Matter” show.
Huh? Oil peaked at $38 a barrel, equivalent to about $124 a barrel today, fell gradually to about $28 a barrel in 1985, then plunged to under $13 in 1986.
“I do not recall food and energy (who needs them?) retrenching.”
Energy was all over the map. Oil was $1.75/bbl in 1971, and peaked at $42/bbl in 1982 (I think that’s West Texas crude … but there’s more than one kind of oil / one price) That peak, inflation adjusted, is about the current price per barrel.
This price rise occurred because the OPEC producers were not happy with the Yom Kippur war. Daniel Yergin reports no more than 3% of worldwide supply was interrupted by using the “oil weapon”–something that should remind us how essential it is.
Reagan lucked out because Alaska’s North Slope came online during his presidency, helping with that later price decline, but he would have been in a world of hurt had that not happened…although I’d bet the American public would have elected someone even worse in reaction to Reagan (and really Nixon’s) incompetence. (“Americans are a primitive people disguised by the latest inventions” – George Santayana) Reagan is the guy who took the solar panels off of the White House.
….revivifying the 2008 playbook perhaps? Sans the funk loans.
Making bank for the roll-up…daytime deals.
more homes for the ‘rentiers’….runs on rental vans, store it places
not cheap, options seemingly rushed
wait, maybe your former place….for rent
44% of ‘current earnings’ now……’owned it’ for 34% u say?
not so long ago….there being many who know….knew
Reaping the harvest of 30 years of parasitic financialization of the economy killing the goose that laid the golden eggs.
The usd has only one way to go- weaker. Once Trumpolini’s guy gets in at the fed and rates lowered, weaker yet.
I agree, this looks like stagflation to me as well. As always, a few will benefit and the majority will suffer. Another indicator is the labor participation, which does not look very promising either. And when more workers are “made redundant” by AI, automation, and cutbacks, we can expect the trend to worsen.
https://fred.stlouisfed.org/series/CIVPART
Also, with the federal deficit spending: what kind of spending? Is it military? How much of it will be injected into the US economy to benefit the majority? If the spending is mostly abroad, one would think that just adds to the dollar glut that ends up abroad or rolled over into dollar-denominated financial assets.
With the DT2 regime’s and Congress cutbacks on social programs etc. Federal deficit spending may have a limited, or negative effect this go round. We shall see but it does not look very rosy.
Recession starting in the fall would be very bad for Trump, but worse for the GOP. You can kiss the House goodbye. Adios, Swamp Stooge!
Have yourself, a Very Merry Christmas, GDP flat-lined…
Do not underestimate the ability of the Democrats to blow the mid-terms.
I expect it. Dem consultants believing fake poll data & basing messaging & funding allocations upon it .. a near certainty.
I have a modestly different take on US government deficits. Because they are essentially putting money into the billionaire classes bank accounts this is an unproductive deficit. The money gets applied to inflating the value of financial assets, real estate, bananas taped to a wall, etc.
If these deficits were used for building and replacing desperate rundown infrastructure, schools and education, medical and health care, etc. my bet is they would be looked at as more akin to an investment in a healthy economy and society, as well as spurring productivity growth.
So we are looking at continued impoverishment of the mass of society.
Let’s not forget that between Biden and Trump, $1.3 trillion (about $4,000 per American) has been pumped into the economy through deficit spending so far this fiscal year. That deficit works out to about 4.3% of a $30 trillion GDP – one that has grown at a 1.3% annualized rate in the first 6 months. https://fiscaldata.treasury.gov/datasets/debt-to-the-penny/debt-to-the-penny