Yves here. Not surprisingly, economists are finding it hard to estimate the longer-term economic costs of highly destructive weather, since those events vary in type, geographic extent, and intensity. But these exercises areimportant in that (assuming a more enlightened future Administration than Team Trump) that they might influence the scale of relief efforts, and perhaps strengthen the case for climate change containment. This article also finds that better in-region infrastructure can blunt the impact of weather disasters.
While this piece looks like an important addition to a growing literature, the notion that weather disasters are localized is a tell that the focus is too narrow, and includes only incidents like hurricanes, catastrophic floods, and perhaps wildfires. Yet even though it also lists heatwaves, it’s not clear how they modeled the cost of much higher power use (for those who can afford it), potential grid failures or brownouts, and heat-induced deaths.
By Hélia Costa,Economist Organisation for Economic Co-Operation and Development (OECD) and John Hooley, Senior Economist International Monetary Fund. Originally published at VoxEU
Extreme weather events are increasing in frequency and intensity, yet their macroeconomic impacts remain poorly understood. This column argues that the highly localised nature of climate-related natural disasters means impacts should be assessed at the subnational level, with explicit accounting for cross-region spillovers. Such an approach uncovers significant adverse effects of about 0.3% of GDP per year in OECD economies, roughly half occurring outside the disaster zone via negative spillovers.
Extreme weather events – such as catastrophic floods or prolonged heatwaves – are increasing in frequency and intensity (IPCC 2021). This has sharpened the focus of policymakers ahead of COP30 on the economic resilience of developing and advanced economies. While there is a growing consensus that these events cause serious macroeconomic losses (Krebel et al. 2025), accurately quantifying them remains difficult (Aerts et al. 2024).
For advanced economies, evidence of strong and significant negative effects has been more challenging to document, especially in studies using cross-country data (Botzen et al. 2019, Klomp and Valckx 2014). There is growing recognition that the highly localised nature of weather shocks calls for studying their impacts at a subnational level (Goujon et al. 2024, Dell et al. 2014), and that combining granular data across countries and event types is essential to fully capture their macroeconomic effects.
Against this background, in new work (Costa and Hooley 2025), we use regional data for over 1,600 regions across 31 OECD countries from 2000 to 2018 to assess the economic consequences of extreme weather events in advanced economies, including how impacts propagate beyond the original event location via spillovers.
Large, Persistent, and Non-Linear Impacts
The most severe events reduce GDP in a region directly affected by a disaster by up to 2.2% relative to trend, with losses of around 1.7% persisting after five years (Figure 1). But not all disasters matter equally. The most severe events – defined as affecting at least 0.1% of a region’s population – generate disproportionately larger output losses than more moderate disasters, while minor disasters show no measurable GDP impact. Such non-linearity has also been documented by others (Felbermayr and Gröschl 2014) and is likely due to capacity constraints – technical and organisational limits that bind only in big disasters (Hallegatte et al. 2007). Small shocks are absorbed; large ones overwhelm.
Figure 1 Change in the level of real GDP following severe disasters (percent)
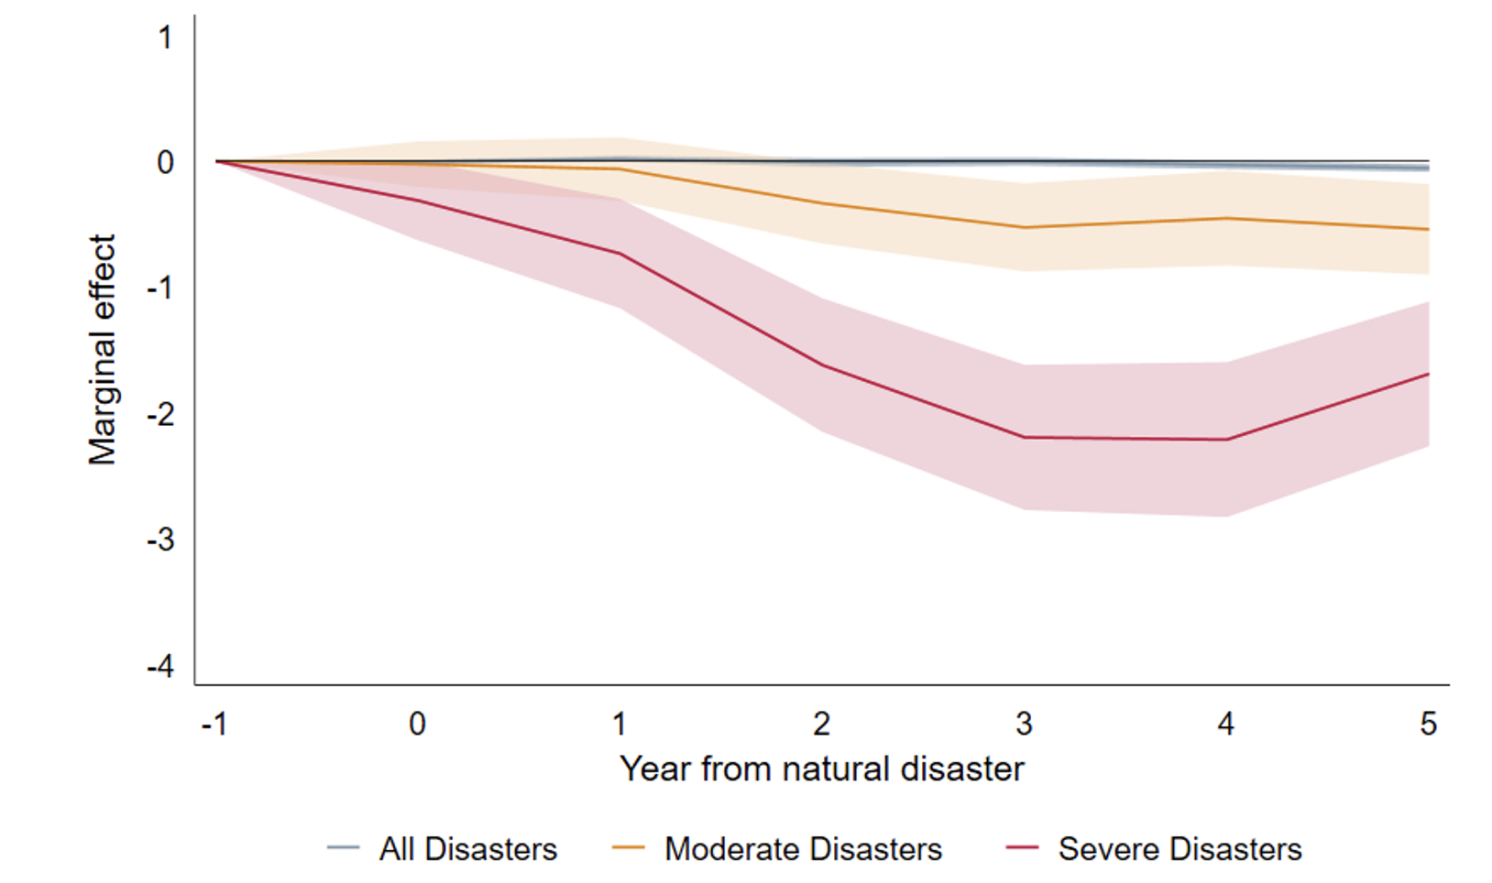
Note: Lines show local projection estimates at each horizon after the disaster for all, moderate, and severe disasters; shaded bands are 90% confidence intervals.
Source: Costa and Hooley (2025); data: OECD, EM-DAT, GDIS (Rosvold and Buhaug 2021).
Labour markets are a key adjustment channel: employment declines in line with GDP and affected regions see net outward migration. Mobility is an important coping mechanism for households, but it can also deepen local output losses by eroding demand and depleting human capital.
Severe disasters also put downward pressure on prices: the GDP deflator declines to about 1% below trend in the medium term. Demand shortfalls dominate any supply-side inflationary pressures from damaged capital, disrupted production and labour market dislocations.
These are net effects on output and prices, so they already incorporate offsetting forces such as reconstruction spending, insurance payouts, and government relief transfers. The persistence of large losses shows that such support, while helpful, is, on average, insufficient to return the economy to its pre-disaster path.
Negative Spillovers to Neighbouring Regions
The economic damage does not stop at regional borders. We identify material negative spillovers: a severe disaster occurring within 100 km of a region leads to a further 0.5% decline in GDP – roughly a quarter of the direct effect. These spillover channels are likely to reflect several factors, including disrupted supply chains, reduced demand from nearby affected areas, and population displacement.
Combining direct and spillover effects and aggregating across OECD countries, severe disasters in our sample reduced GDP by over 0.3% per year on average, with spillovers contributing roughly half of the total loss (Figure 2).
Figure 2 Average annual impact of severe disasters on OECD GDP during 2006-2018 (percent)
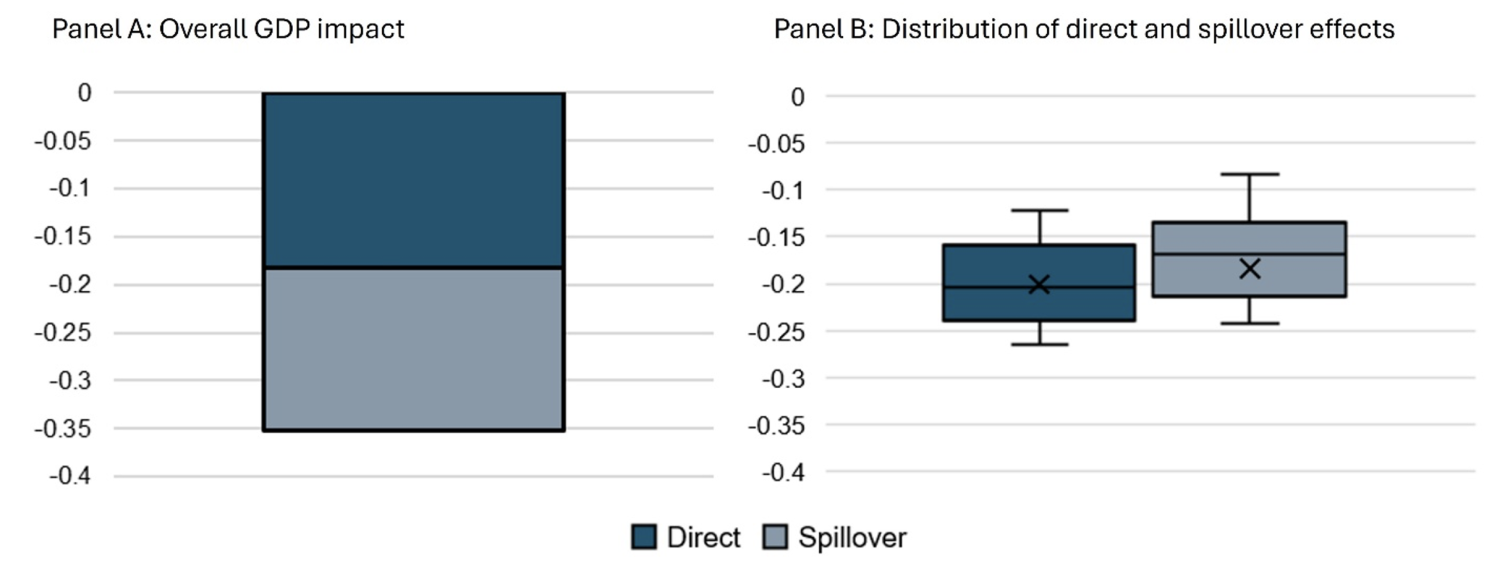
Note: Panel A shows the average annual GDP loss across 31 OECD countries (2006–2018) from severe disasters, combining direct effects and spillovers from events within 100 km. Losses are derived by applying estimated elasticities over a five-year horizon and aggregating from region to country. Panel B plots the distribution of country yearly direct and spillover effects. The marker and horizontal line denote the mean and median, the top and bottom of the box denotes the interquartile range, and the whiskers denote the min and max values.
Source: Costa and Hooley (2025); data: OECD, EM-DAT, GDIS (Rosvold and Buhaug 2021).
Why Some Regions Are More Resilient
The capacity of regions to withstand and recover from disasters varies significantly. Fiscal space matters: regions in countries with lower debt-to-GDP recover more quickly, as governments can deploy effective post-disaster support without requiring offsetting austerity measures that could exacerbate the economic downturn (Canova and Pappa 2021). Economic diversification and labour mobility also enhance resilience: diversified economies can shift activity to less-affected sectors, and higher mobility speeds up reallocation and limits persistent unemployment (Beyer and Smets 2015).
Sectoral patterns also differ sharply. Industrial output falls by more than twice as much as output in services after a severe disaster – unsurprising given industry’s reliance on fixed capital and networked supply chains – but it tends to rebound faster in the medium term as supply chains are restored and reconstruction spending ramps up.
Policy Implications
Quantifying the potential economic losses caused by natural disasters is crucial for effective planning and decision-making. Our estimates – showing large, non-linear, and persistent costs even in advanced economies – call for climate damage projections to explicitly incorporate extreme-event impacts. The task is challenging, however, and while recent work has begun to incorporate temperature and precipitation volatility into climate damage functions, the most extreme ‘tail’ events are unlikely to be captured (Aerts et al. 2024).
The scale of losses also underscores the urgency of adaptation efforts in advanced economies, including investment in adaptive infrastructure – flood barriers, water storage, resilient transport and power – alongside credible post-disaster plans and deeper insurance markets (OECD 2024).
Our evidence of negative spillovers furthermore carries a clear policy message: climate adaptation cannot narrowly focus on the location of a potential hazard. When around half of the economic damage from natural disasters occurs in regions that are not directly hit, such a strategy would leave major costs unaddressed.
This points to several complementary priorities:
- Infrastructure resilience beyond the hazard zone. If supply chain disruptions drive negative economic spillovers, then resilient infrastructure investment needs to consider network effects.
- Cross-border coordination mechanisms. Effective disaster response requires shared early warning systems, joint disaster response and recovery plans, and potentially coordinated fiscal support.
- Reduce labour market frictions to reallocation. Promoting more flexible labour market institutions and targeted upskilling initiatives can help displaced workers transition more quickly into new employment in less-affected sectors, or regions.
Strengthening resilience to spillover effects – alongside broader adaptation efforts – is critical to cushion the economic and social impacts of extreme weather and to prevent disasters from widening regional inequalities.
See original post for references


To add to the point about disasters not being so localized, there was an article in links a few weeks ago, I believe, discussing how rising heat globally (leading to water displacement eg. from glaciers resulting in pressure changes on the crust) may actually be making an impact on the frequency of earthquakes, with the likelihood of them increasing.
The other issue is that, with the climate changing, weather patterns are changing as well. I’m not a climatologist by any means but I would not be surprised if this has led to what seems to be more unusual weather events (in place and time) than would be expected. Even Melissa persistently developed contrary to expectations right up to when it eventually hit Jamaica.
I do think that the recommendations made in the article appear useful (I’m also not an expert in this field either) but, having seen the total flattening of Black River, JA (a relatively populous capital of the parish of St. Elizabeth), caused by Melissa, I feel that the most critical policy implementation needs to be reversing course on our climate trajectory in whatever time we have left.
Based on discussions I’ve seen here suggesting that a separate Category 6 designator should be formalized for hurricanes, with Category 5 already able to level even the sturdiest of infrastructures, if we continue on a course to unpredictability, with potentially higher chances of more severe weather events, no amount of infrastructure resilience will help (in my opinion, as a layperson on climate science).
About new categories for hurricanes . . . I would go even further. I would see what the difference is between the bottom and the top of a category. What increase in windspeed gets you from a just-barely-cat-4 hurricane to a just-barely-cat-5 hurricane? Add that increment of increased windspeed to a just-barely cat-5 hurricane and it could be called a cat-6 hurricane. Add another windspeed increase increment that same amount to the just-barely cat-6 hurricane and it becomes a just-barely cat-7 hurricane.
The ability to assign category numbers to hurricanes thus becomes an open-ended ladder. As hurricane windspeed gets faster in the global warming future of tomorrow, we can just keep going up the rungs of the category ladder and assign new categories to hurricanes which might need them.
Once hurricane windspeeds are faster enough, we may need a new name for such newly up-categorizable storms. Perhaps once a hurricane has reached cat-9, we should call anything above a cat-9 hurricane with the new word ” hypercane”. Like,say . . . a Category 10 hypercane, a Category 11 hypercane, etc
Pardon my hijack, but we in the US have suffered a Category 6 unnatural disaster, a political wildfire that is currently wreaking havoc and running wild. Seeking solace in history is useless as unfettered authoritarianism universally leads to disaster. Like the problem, the solution: removal from office, is obvious to most, but given the political weather (a Congressional majority of mindless sycophants) and a system that does not easily or timely change direction, we may get to enjoy the full flower of the effects of this unfolding, unnatural disaster. Please pardon my hijack. Delete if you wish.
I don’t think they are mindless sycophants. I think they are scheming tyrranothoritarians, using Trump as the delivery vehicle and themselves and their various plans to turn America into one big Gilead Confederacy as the payload.
” Forgive them not, but curse them, for they know just what they do.”
There are single extreme occurrences – disasters – which this study considers – “acute” events, but then there are slower incremental changes which need adaptation, but whose cumulative impacts will dwarf disasters – so more classifiable as “chronic” effects. Both can be killers.
Climate belts are migrating; the reliability of rainy seasons; increases in frequency of dry periods; higher annual rainfall; increases in sea temperatures – all are climatic, so longer term, and not single weather events.
Here in Scotland our main food export is salmon, and fish used to spend two summers in open cages. Now the big producers are having to reprogramme their management of the growth cycle so only one summer is in open cages. The reason is that summer water temperatures are almost 5°C higher than a decade ago, and average mortality rates have doubled to over 20% from disease, lice and jelly infestations. Salmon are a cold water fish. Some fishfarms now have over 50% mortality per cycle. None of this shows up in an acute event analysis. But it seriously affects business success and profitability.
Climate change impacts on economic or any other human activity are not restricted to major events and impact analyses will seriously understate the scale of remediation and adaptation if this is the pattern that is relied on.
The danger then is that the decision makers in the political and business elite will be duped into thinking that climate change is more easily manageable and fail to take appropriate action.
Just as they are currently doing.
This is a good start but far more analytical work needs to be done, IMHO.
“Climate change impacts on economic or any other human activity are not restricted to major events and impact analyses will seriously understate the scale of remediation and adaptation if this is the pattern that is relied on.”
I wonder if there are coherent figures for the present and projected [domestic] property devaluations, and its linkage to livelihoods, if and when a region or sub-region is subject to repeated adverse weather events with increasing frequency ? A case in point is the East coast of Australia which now seems to get ‘hit’ by storms and flooding every year. I recall seeing on a news segment one man tell of how his home, then a year or two later his rental being hit by a 1 in 100 year weather event ? He said he wasn’t coming back again. (I couldn’t find a link, apologies there)
A 2024 paper starts to tell the emerging story…
‘Residential mobility responses to home damage caused by floods, cyclones and bushfires in Australia’
https://link.springer.com/article/10.1007/s11111-024-00470-7
The Abstract concludes with this:
“The most disadvantaged Australians thus face a double vulnerability: they are both more likely to sustain home damage from extreme weather events and more likely to be displaced. These findings bear important implications for adaptation strategies and policy responses to natural disasters.”
One would almost be willing to reconsider the the efficacy and overall wisdom of the dominant practice of sedantism. A c- 9,000-12,000 year old practice might need to be set aside. Any readers have figures?
Similar abandonment of whole places looks like rustbelt or old mining towns appear to us… when the ability to earn a livelihood, and/or grow your own food ends in a place, people move on, they have to. But the big question now is will you lose all or most of your equity in property when you have to? I’m thinking Yes, probably. And no one seriously planned for this?
Some 6m English households (25%) are vulnerable to flooding, disruptive events rather than disasters, but increasingly unable to get insurance.
Of course, the finance sector decision makers in the insurance industry are not vulnerable to the personal losses of small residential and business owners.
I think the collective loss of property, and hence capital, has barely crossed the thoughts of most political groups.
In Scotland the number of 150mm+ intense rainfall incidents has increased progressively with climate change. There is regular flood and landslip disruption of rail services, and one awful fatal accident a few years back.
There are over one hundred potential landslips on just 15m of our main road the A83, with deferred remediation works now reckoned at £100m+.
Short term closures and delays are weekly for 6-8 months a year now.
The everyday impact on our lives and reduced tourist revenues are exactly the kind of costs that don’t often show up in cost benefit or impact analyses for capital infrastructure works, and there is little doubt that it is very convenient for the political class to understate the costs of remediating climate change impacts in assessments, given the costs of fiscal programmes.
Moving and resettling our local population of around 25,000 is avoidable with decent levels of infrastructure investment, and the last thing we need is a retreat to the cities globally. Their vulnerability has barely been tested so far, even the LA events were relatively minor and politically manipulated.
Then we have the 60-80m people living in Bangladesh within 2m of river levels and about 300m more on Asian floodplains, which just happen to be very fertile agriculturally.
I am sure there will be some retreat, there has to be just on survival grounds, but I can’t see how massive mobility increases globally can work, especially with the populist right in industrial economies relentlessly stirring the anti-immigrant pot – except to create more wars.
Fiscal space should not matter and I would be interested in any evidence.
For any fiat currency, spending is, by definition, by fiat and does not depend on government revenue. More to the point is what mechanisms exist for centralized governments to deploy money locally? Ditto bank money as local branches close and banking also becomes centralized leaving regions ‘unbanked’.
The only danger of government money creation is the threat of inflation but the evidence appears to be that the effects of climate events are deflationary.
It’s interesting to me that the first implied recommendation is for austerity while an admittedly tentative conclusion might be for new mechanisms to deploy money locally – possibly through insurance networks or, dare I even mention it, public sector banking or even Central Bank digital currencies.
What good is money if there is nothing left to buy with the money?
At 6 a.m. this morning the Glasgow-London train hit a landslip and partially derailed, after very heavy rain. The Scotland – London West Coast Main Line – our main transport artery – will be closed for several days – maybe a week.
This area has had several landslides and rail accidents in the last decade or so, one fatal, and is clearly vulnerable – but has evidently not had sufficient action to protect this infrastructure and essential link from disruption.
This is a classic example of government failing to seek remediation in dealing with extreme weather events, especially repeating one offs, which then have a major economic and social impact, but are not ‘disasters’. This is how climate change impacts end up being underplayed, and having underestimated costs.