Your truly is not keen about having to think as much about stock market price levels as seems warranted of late. It’s pretty obvious AI plays are in a monster bubble, but that does not mean they won’t go even higher before reality drags them back to earth. As we’ve said, historically a stock market rout, unless fueled by lots of debt as in the Great Crash, does not generate a crisis but does damage the economy though investors pulling way back on spending and capital expenditures. That loss of demand is recessionary and can produce deflation and zombification. So the hangover can still do a lot of harm.
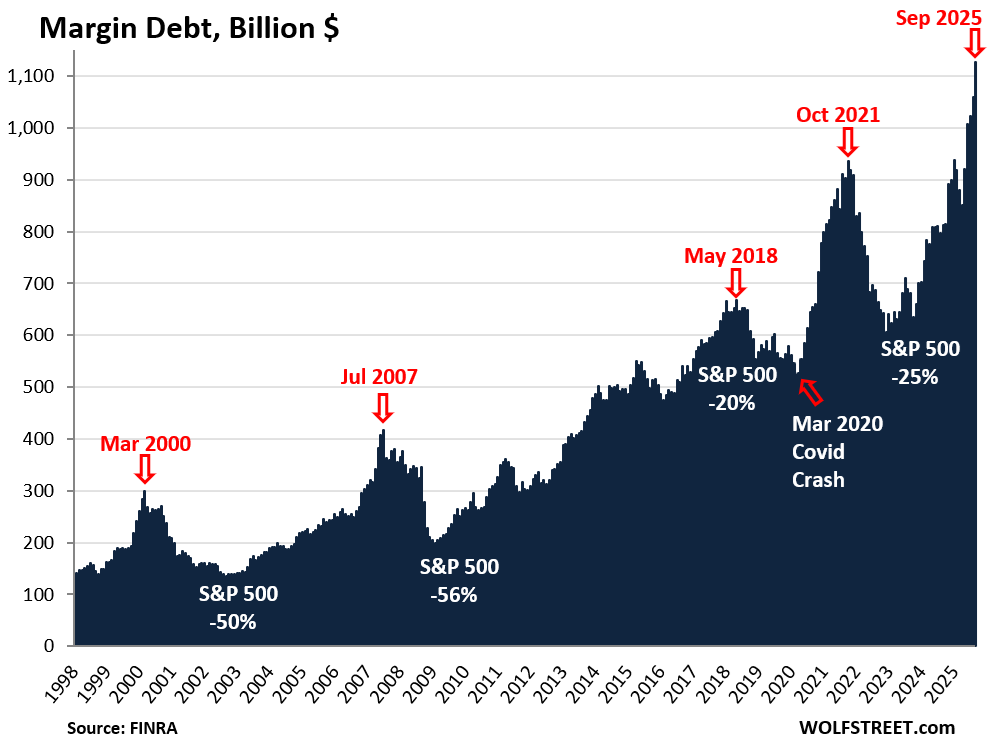
Some market-watching sites, including Wolf Richter’s, have been sounding alarms about US margin debt hitting an all-time high. Here’s Wolf’s chart and a snippet from his commentary:
Leverage in the stock market has been spiking since April. In September, margin debt – the amount investors borrowed from their brokers – spiked by another 6.3%, or by $67 billion, from August to a record $1.13 trillion…
The additional leverage – borrowed money flowing into the stock market – creates buying pressure and drives stock prices higher. Leverage is the great accelerator on the way up, but it’s also the great accelerator on the way down. Multi-month surges in margin debt, jumping from new high to new high, indicate excessive speculation and risk-taking and have invariably led to sharp selloffs:
The wee problem is that while the picture above is accurate, it doesn’t add as much to what we know about stock market frothiness as one might think. Borrowing against stocks is strictly regulated. So when market prices go up a lot, so to does margin borrowing. The chart above does give another demonstration of how sharply stock prices have risen and that when those spells of wild enthusiasm wear off, the forced deleveraging accelerates the plunge.
A rejoinder from the admittedly mainstream Morningstar in August:
Margin debt isn’t a red flag for one investor.
One of the explanations put forward recently for the record-breaking rally in the U.S. stock market was the equally record-breaking amount of margin debt that had been incurred in the process. Money borrowed to invest in shares topped $1 trillion in August.
For Brian Jacobs of Aptus Capital, however, this is not the five-alarm fire it sounds and is less ominous than investors might suspect. Economist David Rosenberg posted on X a few weeks back that the number was “pretty scary” but Jacobs contends it’s merely a coincident indicator, a symptom of the market’s meteoric rise, rather than a signal of its imminent demise.
Jacobs writes in a recent investment blog: “It (margin debt) moves with the market. When equities rise, account values increase, and investors naturally take on more leverage. Margin debt rising 25% over the last year? The S&P 500 SPX is up about the same. Margin debt has almost doubled over the last five years? The S&P 500 is up about the same.”
But having said that, while a crude look at margin debt levels may not do more than demonstrate that stocks have gone up a lot, and quickly of late, other ways of parsing margin borrowing do paint a worrisome picture. At the end of September, Cory McPherson at Pro-Active Capital published Margin Debt Showing Investors Going All In. Key sections:
From the August [2025] numbers, margin debt relative to nominal GDP sits at 3.48%. The record high reading was 3.97% in October 2021. For historical context though, the peak in that ratio was 2.6% in the dot-com bubble days in 2000, and 2.5% in 2007 before the great recession.
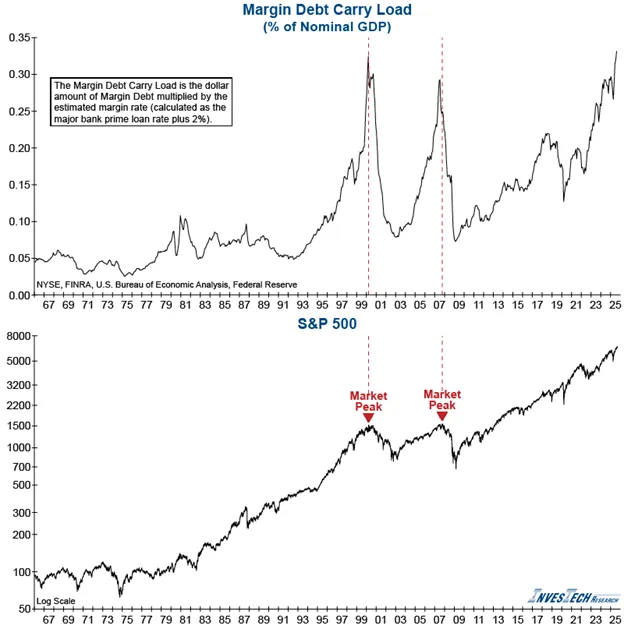
Another way to look at is Margin Debt Carry Load. This factors in the interest being paid on the margin debt. The chart below shows the dollar amount of margin debt multiplied by the estimated margin rate, which is calculated as the major bank prime rate plus 2%. This is then put in % of nominal GDP. You can see we have now reached levels seen during the last stages of the dot-com bubble days in 2000. Margin debt, though, is definitely not a timing indicator. This can continue to get higher and higher, just as the stock market can. What it can do, though, is create violent downturns in the market. When an investor owns stock on margin and that stock goes down a certain amount, the brokerage forces the investor to sell, which can create an elevator down affect, similar to what we saw in April of this year.
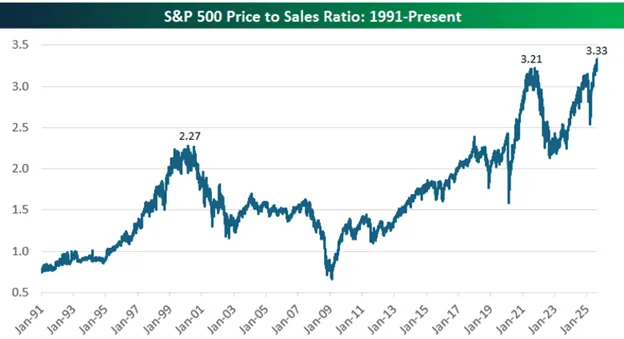
A fundamental metric on the stock market has also reached extreme heights recently. The price to sales ratio is a valuation metric that compares a company’s stock price to its revenue. Basically, a measure of what investors are willing to pay for each dollar of sales from a company. In looking at the price to sales ratio of the S&P 500 (taking the market cap of the S&P 500 and dividing by the total sales of all companies in the S&P 500 over the past 12 months), you can see we’ve surpassed last year’s and 2021’s peak in the ratio. It is also way past the peak that was seen in the dot-com bubble days, which is thought to be one of if not the biggest stock market bubbles in history. Much of this is being driven of course by technology stocks and the AI boom we’ve seen over the last few years. Stock prices have got way ahead of actual sales. While overvaluation doesn’t cause market drops or bear markets, they do often precede them.
McPherson then considers some real economy data anomalies, that the big downward jobs revision happened without a recession, and that the Conference Boards leading indicators have been falling for three years while its coincident indicator continues to rise. It seems that running very large fiscal deficits for a while can produce confusing results.
The reason for concern about stock market froth is rather a lot is riding on it. We pointed out that US households’ stock holding relative to other financial assets was at an all time high:
⚠️This is truly INSANE:
US households now own a RECORD 52% of their financial assets in equities.
This share has more than DOUBLED since the Great Financial Crisis and surpassed the 2000 Dot-Com Bubble by ~5 points.
The hold just 15% in cash and 14% in debt assets. pic.twitter.com/6DRmtxYSze
— Global Markets Investor (@GlobalMktObserv) October 13, 2025
Foreign investors have also wagered a lot in the US casino. The Economist has just posted, Gita Gopinath on the crash that could torch $35trn of wealth. From Gopinath, the former chief economist of the IMF:
Over the past decade and a half, American households have significantly increased their holdings in the stockmarket, encouraged by strong returns and the dominance of American tech firms. Foreign investors, particularly from Europe, have for the same reasons poured capital into American stocks, while simultaneously benefiting from the dollar’s strength. This growing interconnectedness means that any sharp downturn in American markets will reverberate around the world.
To put the potential impact in perspective, I calculate that a market correction of the same magnitude as the dotcom crash could wipe out over $20trn in wealth for American households, equivalent to roughly 70% of American GDP in 2024. This is several times larger than the losses incurred during the crash of the early 2000s. The implications for consumption would be grave. Consumption growth is already weaker than it was preceding the dotcom crash. A shock of this magnitude could cut it by 3.5 percentage points, translating into a two-percentage-point hit to overall GDP growth, even before accounting for declines in investment.
The global fallout would be similarly severe. Foreign investors could face wealth losses exceeding $15trn, or about 20% of the rest of the world’s GDP. For comparison, the dotcom crash resulted in foreign losses of around $2trn, roughly $4trn in today’s money and less than 10% of rest-of-world GDP at the time. This stark increase in spillovers underscores how vulnerable global demand is to shocks originating in America.
Historically, the rest of the world has found some cushion in the dollar’s tendency to rise during crises. This “flight to safety” has helped mitigate the impact of lost dollar-denominated wealth on foreign consumption. The greenback’s strength has long provided global insurance, often appreciating even when the crisis originates in America, as investors seek refuge in dollar assets.
There are, though, reasons to believe that this dynamic may not hold in the next crisis. Despite well-founded expectations that American tariffs and expansionary fiscal policy would bolster the dollar, it has instead fallen against most major currencies…
Compounding the situation, and adding to the overall risk, is the escalation of the tariff wars. Further tit-for-tat tariffs between America and China would damage not just their bilateral trade but global trade too, as almost all countries are exposed to the world’s two largest economies via complex supply chains. More generally, avoiding chaotic or unpredictable policy decisions, including those that threaten central-bank independence, is critical to prevent a market collapse…
In sum, a market crash today is unlikely to result in the brief and relatively benign economic downturn that followed the dotcom bust. There is a lot more wealth on the line now—and much less policy space to soften the blow of a correction. The structural vulnerabilities and macroeconomic cont
Ouch. But you can see why we are watching with bated breath.


Although it is hard to find statistics on how many folks have bought real estate using stocks as collateral, the number of articles discussing this strategy have been increasing.
https://www.mansionglobal.com/articles/how-wealthy-home-buyers-are-leveraging-assets-to-avoid-cash-down-payments-ee2ca043
My neighbours sold their house in San Jose to a couple, one of whom works for Nvidia. I’m under contract selling my house to a couple, one of whom works for Nvidia. Good for them, I suppose, moving stock option money into RE, but when that narrow population of wealthy techies has bought somewhere, who else will buy SFHs? Townhome/condo inventory is rising in the Bay Area, not helped by the egregious (I love the flow of that word) HOA fees here.
“Your truly is not keen about having to think as much about stock market price levels as seems warranted of late. ”
It’s situational awareness. How can it not be noticed that, just about all over the world, the stock markets behave like geopolitical threats are bullish?
It has been just about a long enough time since the big financial crash of 1929 for the lessons learned then to have been forgotten. The more recent “crashes” happened under at least a modicum of the Post 1929 regulatory paradigm to have softened those blows to the economy. Today, thanks to the Bull Market in the China Shop gutting of most post 1929 Crash regulations, the American economy is almost as vulnerable to “excess exuberance” and its attendant profligacies as it was back then. And yet, our present day Neo-liberal Masters of the Multiverse expect the outcomes to be different this time.
A rising tide may float all boats, but it also drowns those without boats. Anecdotally, many a lifeboat has been swamped and overturned by frantic crowds of sinking people grabbing to the gunwales, trying to get aboard. Elon had better get his Mars Project up and running fast before the window of opportunity slams shut for a generation.
Stay safe.
I am sure Minsky would say that it’s been long enough since 2008 for that experience to be forgotten.
But the system seems to insulate against lessons being learned anyway.
One other scary metric is $7 trillion in cash, money market funds and other short term instruments. That potential avalanche into markets would seem to restrict Fed options as they meet periodically to thread needles.
the even bigger story same-day index and stock options—which makes sense given (by recent standards) sky-high margin rates, if you want leverage, options make sense.
Relatedly,
Retail Traders Drive Record Options Volume Amid Market Turmoil: A New Era of Influence
question on the Gopinath snippet: is he implying another currency might replace the dollar as a haven in a crisis?
There isn’t one. We saw a mini version in April. Investors ran to many currencies rather than piling into one. China has currency controls. If the dollar has a real crisis, the EU will need swap lines which amusingly will somewhat alleviate the damage.
As I said in a comment on a another blog entry, let’s remember that the US is currently running a 6% budget deficit if not higher…during the Dot Bomb we were technically in a surplus….In my opinion, this thing can still go on for a while, it’s like having an hydrant wide open on one side of the tub, $1T of additional “debt” every 100 days or so.
Funding strains starting to show up in SOFR markets, Fed’s standing repo facility starting to get some use, perhaps from the regional banks finding more cockroaches. Everyone has been speculating because the returns were too good to ignore. Very few have the patience and experience of Mr Buffet who knows from times past that the only good move is to stay out. Will be fascinating to find out if he has gone from T bills to gold in size.
You have to be very close to the liquidity spigot now, access is being restricted to political favourites.
FINRA datashows blowoff tops in dot com and GR, the 5 months preceding them total margin debt rose 52 and 32% respectively. Interestingly, margin debt in the 5 months ending September this year is shown up 31% at 1.2 trillion, bearing in mind that most other months in growth eras fluctuate around +/- 1.5%. However, in the given cases FINRA debt never went to zero, down just a bit over 50% before launching itself off the bottom towards a new peak.
In the examples I used the very next month showed a margin decline of 10-13%, I think record 1-month declines in the 28-yr data. Perhaps this is smart money exiting.
Anyway, in these two cases margin peak info arrived at, or a couple months before, market tops.
Debt subsequently declines until it has clearly turned up again, say 3-4 months of steady growth, signaling both debt and market have bottomed.
2 is not many cases. Hafta look at the Covid crash.
I read somebody saying maybe another 20%. As did a pundit I like. Could be.
“The stock market can remain irrational longer than you or I can remain solvent.”
– Original author unknown. Louis Rukeyser often quoted this on the Wall Street Week tv show.