Yves here. I held back initially from republishing this post because it didn’t acknowledge an MMT perspective. But on further thought, I realized that isn’t germane. Taxes and spending have distributional effects. You can have regressive taxes, regressive spending, and regressive bailouts even with liberal application of net fiscal spending up to an inflation constraint. And this article describes the finesse that has institutionalized regressive bailouts: supporting wealth at the expense of incomes. And in states that are not currency issuers (and the Eurozone is run as if it wasn’t one by not allowing for EU-level fiscal spending), it is correct to say that “taxpayers” fund bailouts.
By Pirmin Fessler,Senior Economist, Austrian Central Bank and Martin Schürz
Head of Monetary Unit, Oesterreichische Nationalbank, Economic Analysis Division. Originally published at the Institute for New Economic Thinking website
A side effect of the 2008 financial crisis was that the average taxpayer had to dig deep into her and her children’s pockets to save many financial assets. Given the uneven concentration of financial assets, this rescue mission was in fact a bailout of the rich. At the time, advocates argued that these side effects were warranted in the interest of the common good, for the sake of stabilizing and ensuring the future income of everybody in society.
Ultimately, though, private wealth was saved for the benefit of its owners. As the markets recovered in the following years, banks made tremendous profits, share values increased, and the private wealth laboriously saved by the many was again a great source of income for the few. The narrative for the many was, again, that it would be good for them to save more from their labor income and take some entrepreneurial risk in order to participate in the thriving economy. But why couldn’t they reap any of the benefits they had made possible in the first place by having rescued all these assets? Because none of the future income made possible by the joint efforts of the rescue teams was earmarked for public sharing.
A mere ten years later, the real economy has been hit by another crisis. This time the crisis is hitting private wealth in the form of private businesses. That’s why the support for the rescue policies is even larger now and the goal is clear: private wealth must be saved.
The argument is once again that there is no alternative; if we do not save the private wealth that is at stake, everybody will suffer. But ownership of private businesses is extremely concentrated. Again, income earned by the many is used to save the wealth of the few. And indeed, history repeats itself as a tragedy for the many: none of the current plans envisage increasing public wealth or reducing the concentration of private wealth.
Actually, the side effects will be even worse this time. The economy after the crisis will likely be one where market concentration is higher and power positions in society are more stable than before. As the crisis hits the poor the most and as it will increase unemployment for a longer period of time, the bargaining power of workers will be lower.
The economic discussion around whether the COVID-19 crisis will depress gross domestic product (GDP) by 5%, 10%, or 20% misses the point and deceives the general public: the problem in this crisis is that the numbers go down for the many but go up for the few. Most people do not reflect on the fact that staring at GDP numbers to measure the success of an economy implicitly means accepting that every euro or dollar of income matters the same no matter if it helps somebody to survive, or live a decent life, or if it produces just marginal changes on a bank account with many zeros. But GDP is the sum of yearly incomes. Over the last decades, a rising share of GDP has been derived from capital income. And highly concentrated private wealth has also grown much faster than GDP itself, amounting to 5 to 6 times yearly GDP by now.
The Average of Trees Is Not a Forest – But Likely Closer to Sawdust
Olivier Blanchard recently tweeted that “much of the progress in macro in the last 40 years came from the assumption of ergodicity” (25.04.2020). He argues that that is the reason why macroeconomic models “have a hard time dealing with the current data.” One description of an ergodic scenario is that the average outcome of a group is the same as the average outcome of an individual over time. But the almost religious belief in the usefulness of averages and aggregates is not only a problem of macroeconomics or GDP alone. In a different way, a similar problem materializes in microeconomic empirical research on inequality.
In the midst of this crisis, the European Central Bank (ECB) recently published the results from its 3rdwave of the Household Finance and Consumption Survey (HFCS). The HFCS is a large-scale household survey similar to the Survey of Consumer Finances and has come to be the main source for analyzing wealth inequality in continental Europe. One would expect this would be the tool of choice for making all the potential consequences of crisis policies more transparent. It would give scientists, policy makers, and the general public a better grasp of how the current policy interventions redistribute resources accumulated in the past and likely to be accumulated in the future – or, in other words, enhance understanding of who benefits to what degree. However, the crucial messages of the ECB on the development of wealth inequality remained surprisingly Delphic:
a reduction in inequality in the lower half of the distribution and an increase in inequality in the upper half. All in all, there was a slight compression of the net wealth distribution.
It is unclear on which inequality measures or form of analysis this statement of the ECB is based on. One actually has to read the accompanying Statistical Report to find a few nuggets of information on wealth inequality in its appendix table J4.
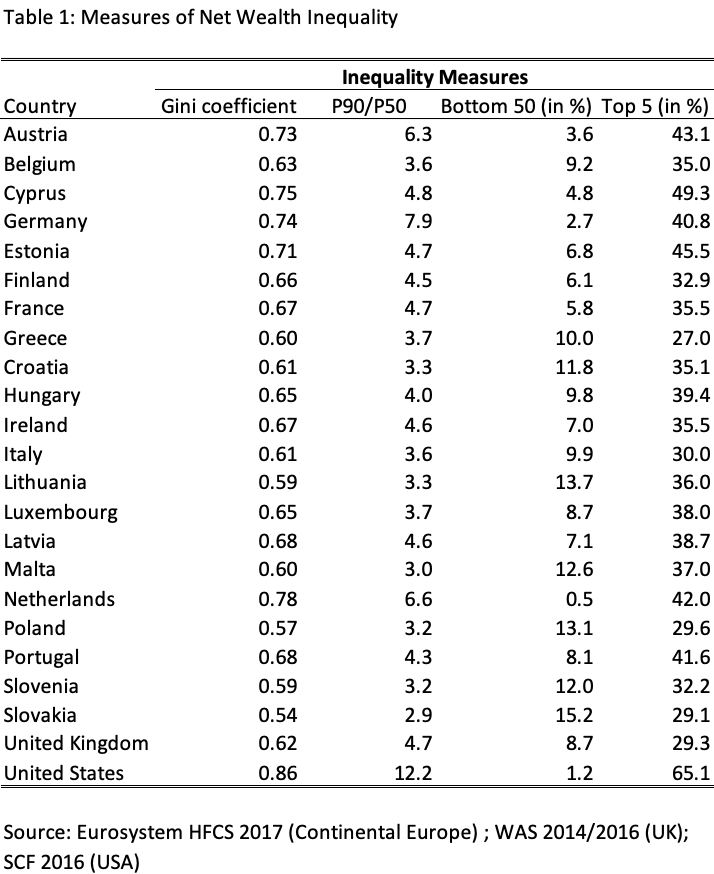
Table 1 shows inequality measures based on the ECB data, to which we have added comparable data for the US (Survey of Consumer Finances) and the UK (Wealth and Asset Survey). These measures tell us that the inequality of net wealth is high. It is high in all countries, but in some it is especially high: in the USA or in Cyprus, for example, but also in Austria, Germany or the Netherlands. By contrast, and somewhat surprisingly, the wealth inequality measure is rather low for the UK.
The ECB ignores cross-country comparisons and pools the data for the euro area countries instead. But pooling the data for households living in 21 different European countries boils down to merging data that carry disparate meanings of wealth. In some countries, people have to rely on their wealth for health services and retirement, while in other countries, these services are provided by the state. Thus, the absolute and relative levels of wealth must differ accordingly across countries. Private wealth plainly fulfills different functions across countries, given cross-country institutional differences from pension systems to labor markets and housing. A given wealth share will mean different things and a different kind of social reality in different countries, depending on how workers’ rights, anti-trust laws, regulatory regimes, the welfare state, and the tax system differ.
Figure 1 illustrates this phenomenon showing the highly significant correlation between public social security expenditures and the wealth share of the bottom 50%. For low-wealth households, wealth largely fulfills a contingency function. The more of this function that is provided by the state through public health insurance, unemployment insurance, state pensions, public housing and so on, the less private wealth is needed to ensure adequate insurance, pension coverage, and proper housing. After all, most people live in a kind of income world.
Figure 1: Net wealth share of bottom 50 and social security expenditure
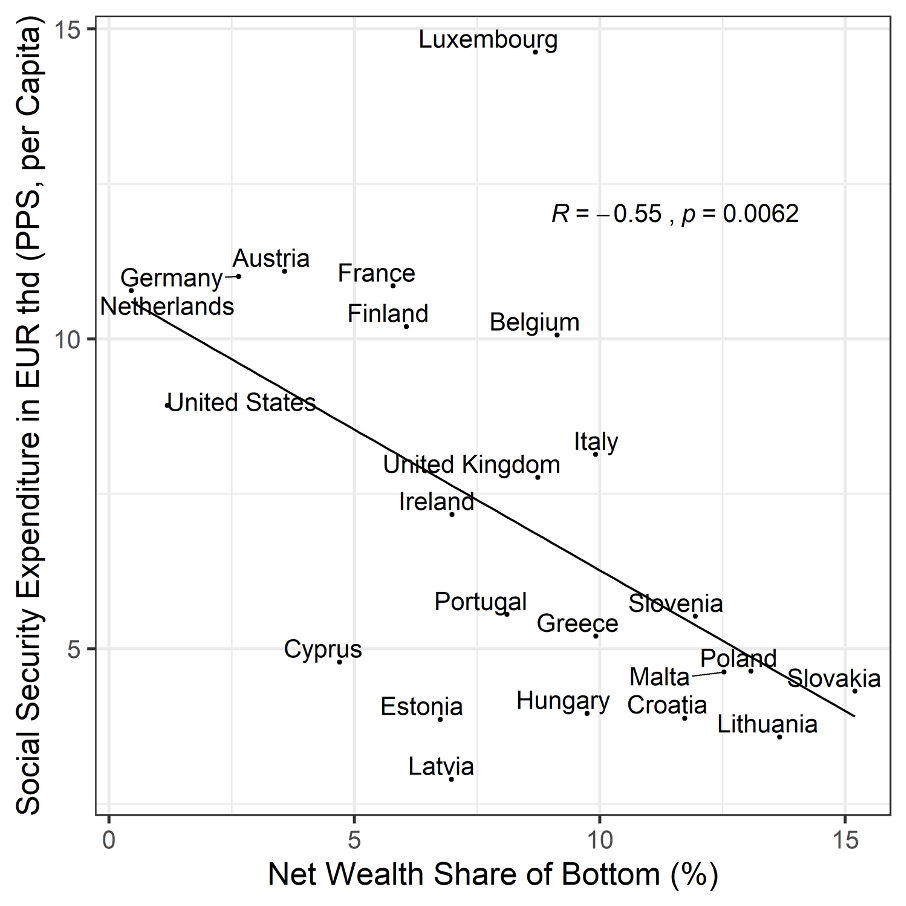
Source: Eurosystem HFCS 2017 (Continental Europe); WAS 2014/2016 (UK); SCF 2016 (USA); OECD 2016; Eurostat 2016.
See our dashboard for more standard cross-country analysis of the new European HFCS data.
Looking at Wealth Through the Class Lenses
Different functions of wealth are key to understanding the wealth distribution. While housing is the main asset for middle class households, it is only one part of the puzzle and far from being the key to understanding overall wealth inequality.
Measuring wealth is by no means straightforward. The methods used to present the observed data structures shape how we see social reality. Household surveys are plagued with problems when it comes to measuring the wealth of the rich. The top 1% in the survey does not adequately represent the households constituting the top 1% of our societies. The use of statistical models such as the Pareto distribution cannot change the fact that we neither know who the rich are nor how rich they are. The wealth share of a statistical percentile alone does not allow for any normative interpretation.
In the following we apply an alternative approach (see Fessler and Schürz 2020). Making the power and production relations explicit in the statistical analysis of wealth inequality takes our argument forward by creating a more coherent analysis of wealth inequality. It therefore also allows us to better see how the current crisis policies affect different households differently. Socioeconomic information on the wealth holders derived from household wealth surveys allow us to reconstruct social classes. That is a great advantage over the administrative data that are often used to estimate top shares. Basically, three classes suffice to characterize the social structure of society: renters, owners, and capitalists.
These classes can be easily defined: Renters rent their homes and hold wealth mainly for precautionary reasons. Owners own their homes and use their wealth also for living, thus generating non-cash income (imputed rent) from their wealth. Capitalists not only own their homes but even rent out further real estate and/or have self-employed business wealth. For them, wealth is an important source of cash income. In other words, income and wealth are linked in different ways for different classes.
Figure 2 shows estimates for the share of renters, owners, and capitalists in the US, Germany, and the United Kingdom across the wealth distribution. The lines show class location and display the probability of a household at a certain point of the wealth distribution being a renter, an owner, or a capitalist. Renters are at the bottom, owners in the middle, and capitalists at the top of the wealth distribution. This picture does not change much if we control for education, occupation, or age; and the pattern is generally the same for all euro area countries (not shown). The country-specific findings differ due to the degree of variation in institutional settings, tax law, history, the welfare state, and so on.
The UK is an impressive example for the impact of the housing revolution. The conclusion is that there is no sense in defining ex ante specific groups based on percentiles unrelated to social realities.
Figure 2: Class location across the wealth distribution
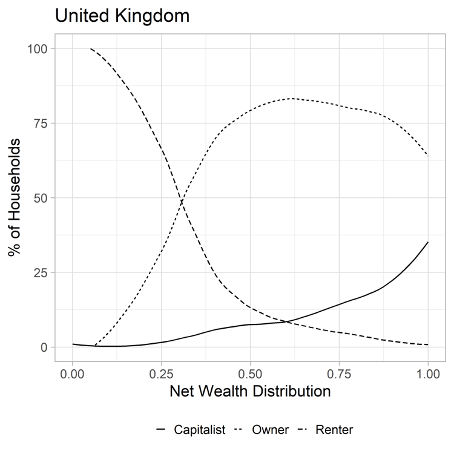
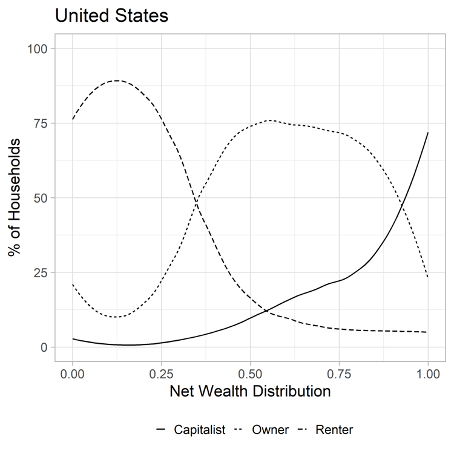
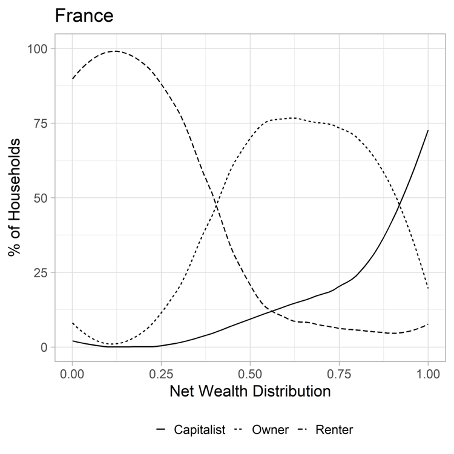
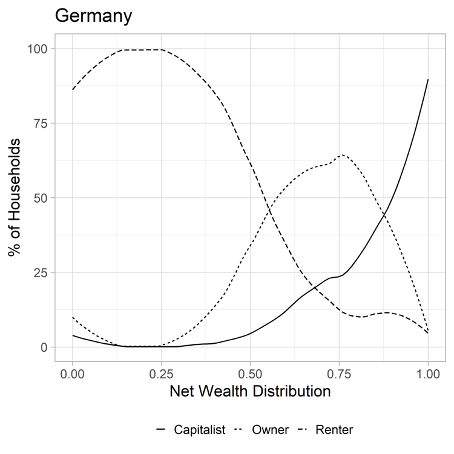
Source: Eurosystem HFCS 2017 (Continental Europe); WAS 2014/2016 (UK); SCF 2016 (USA).
Figure 3 relates the share in gross income as well as the share in net wealth to the respective population shares of renters, owners, and capitalists. In both graphs, countries are sorted by the ratio of owners. This ratio is close to one in all countries, which means that a group’s share in income and wealth is very close to its population share.
We see that wealth inequality in society is a function of the differences between renters and capitalists. The world of homeowners is rather equal and close to overall means, whereas inequality is driven by differences between renters and capitalists. However, a policy approach aiming at a society of homeowners is misguided.
Figure 3: Class shares of income and wealth in relation to population shares
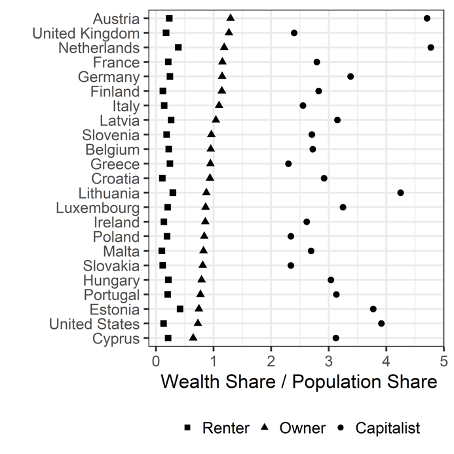
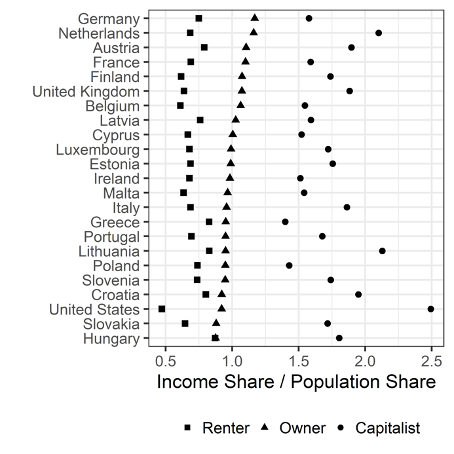
Source: Eurosystem HFCS 2017 (Continental Europe); WAS 2014/2016 (UK); SCF 2016 (USA).
Figure 4 presents disaggregated wealth-to-income ratios for Europe. Class variation is far more important than country variation. People within classes are more similar than people within countries. Thus, when looking for justifications of wealth inequality, we should shift our focus away from country comparisons to social classes instead. Furthermore, wealth-to-income ratios give us an idea of the importance of inheritances within social classes, which make them a proxy for the stability of class membership and class location over generations. It is a major function of wealth to serve as a resource of consumption in precarious times with little income.
Figure 4: Wealth to income ratios of renters, owners and capitalists
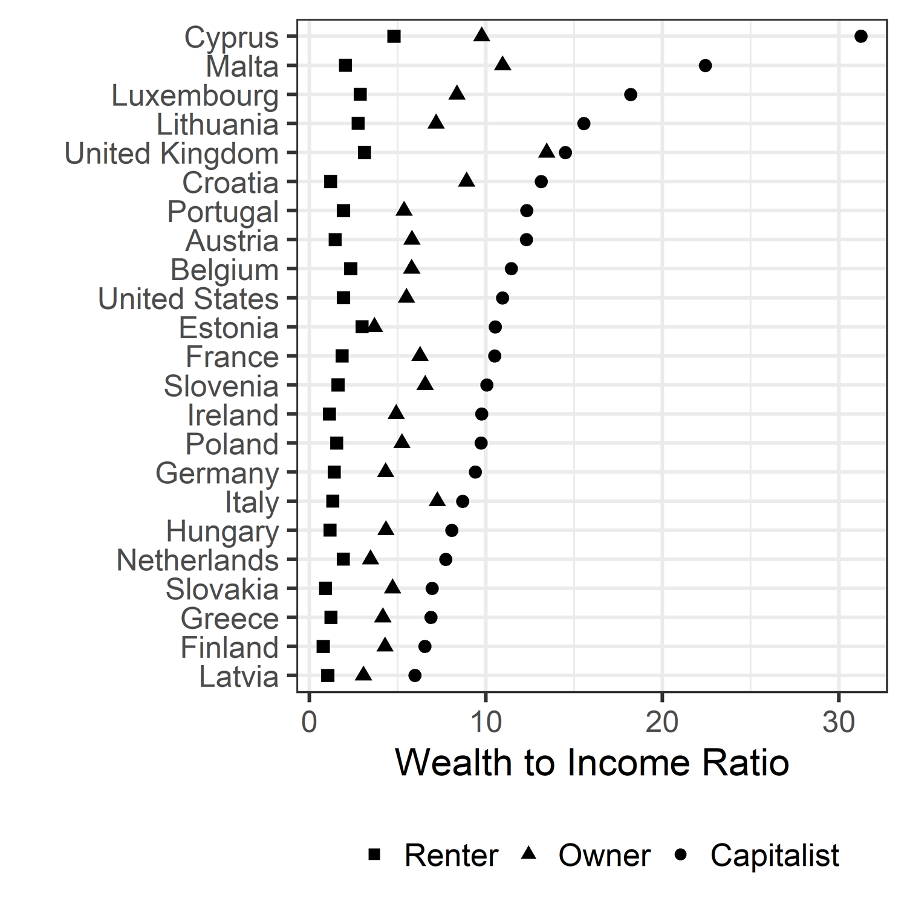
Source: Eurosystem HFCS 2017 (Continental Europe); WAS 2014/2016 (UK); SCF 2016 (USA).
Renters are crucially dependent on selling their labor, since they do not have cash-income from capital while having to pay rent. Figure 5 speaks directly to this important social relation in society. It answers the question of how many typically priced years of labor a capitalist, who has relevant cash income from wealth, can buy from a renter, who relies completely on labor income and does not have relevant cash (income from renting out real estate or self-employed business) or non-cash (owner occupation) income.
Figure 5: Capitalists’ mean (median) wealth in years of renters’ mean (median) income
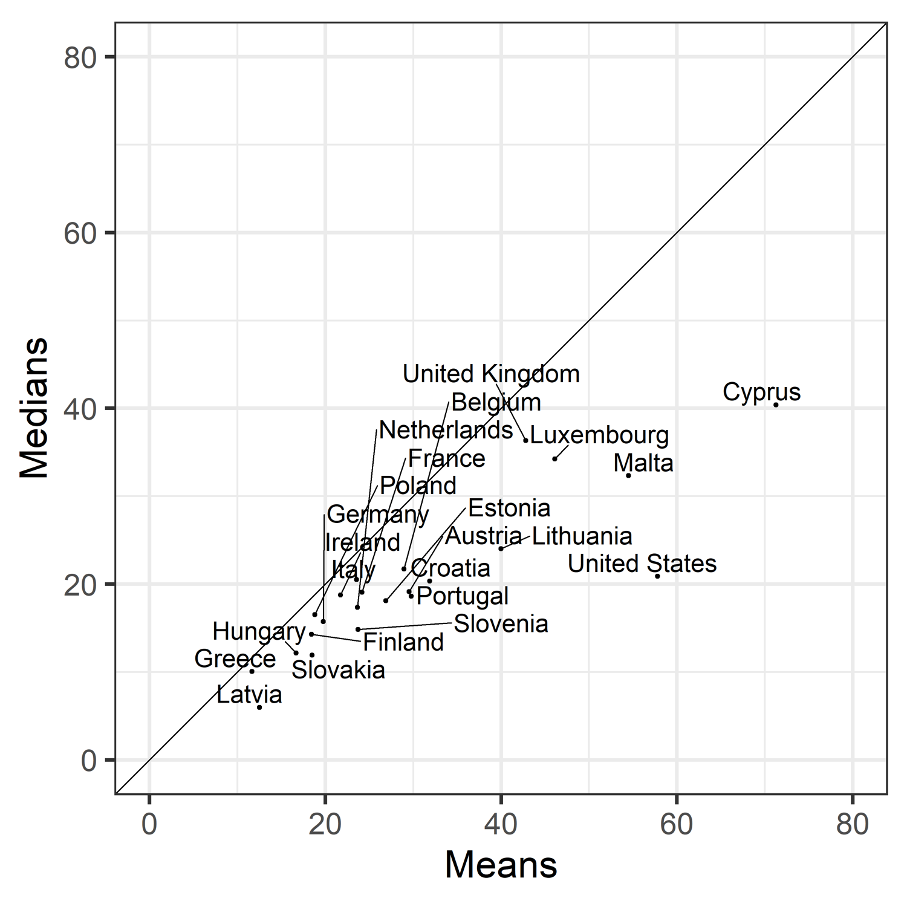
Source: Eurosystem HFCS 2017 (Continental Europe); WAS 2014/2016 (UK); SCF 2016 (USA).
Perspectives Matter
The measurement of wealth influences how people think about the distribution of wealth and its relevance in society. In the COVID-19 crisis, it is becoming clear once more why distinguishing between the different functions of wealth is so important.
If we measure wealth inequality by the Gini coefficient, people will understand the dramatic differences in quality of life and will continue to think along the line of country comparisons. If we measure wealth along class lines rather than percentiles we see more clearly: divided we stand. It is impossible to arrive at a rational justification of wealth inequality as there is no “we” when it comes to private wealth. The broad “whatever it takes” commitment underlying COVID-19 programs across the world seems to provide answers for all different kinds of needs in crisis. However, this approach hides the massive distributional impact.
Saving every private business without becoming an owner or at least gaining some entitlement to future profits boils down to saving the wealth of the rich – the capitalists. Governments, which are highly influenced by the wealthy, use the money of the many to save the wealth of their donors (see Ferguson, Jorgenson and Chen 2018). Subsidizing income of the poor for a few months is not comparable to using the income of all to secure the wealth of the few. Especially because this wealth is income generating and linked to power. The public rescue programs related to the coronavirus underline even further the necessity of a rigid wealth versus income distinction (see Jake Johnson’s recent article)
Both GDP and wealth have increased strongly in the last decades, but private wealth has grown much faster than income, as evidenced by the strong rise in wealth-to-income ratios in the last 50 years. The decisive question is: How can it be that, after just a few weeks of income losses, large parts of the population face fears of being unable to keep servicing their debt, paying their rent, or even buying food? How can it be that we have no system in place that allows people to just live on without selling their labor power if they cannot? Any government should be measured against benchmarks such as ensuring that nobody is worse off in real terms than a median household in the mid-nineteen nineties. Keeping the focus on the average means keeping the focus on those who are well off – with or without crisis.
The virus does not make us all equal. There is a vast difference between having one’s wealth protected and getting a small, temporary income transfer. There is a huge difference between rescuing shareholders or enterprises or people, between saving wealth and saving income. The so-called “side effects” should, in fact, be the main concern of policymaking in this crisis.
Literature
Ferguson, Thomas, Paul Jorgensen, and Jie Chen (2018): “Industrial Structure and Party Competition in an Age of Hunger Games: Donald Trump and the 2018 Presidential Election,” Institute for New Economic Thinking Working Paper No. 66, https://dx.doi.org/10.2139/ssr…
Fessler, Pirmin and Martin Schürz (2020): Structuring the Analysis of Wealth Inequality using the Functions of Wealth: A Class-Based Approach, NBER Chapters, in: Measuring and Understanding the Distribution and Intra/Inter-Generational Mobility of Income and Wealth, National Bureau of Economic Research, Inc., forthcoming. https://www.nber.org/chapters/…


I didnt understand the gini coefficient in table 1. Anyone can explain please?
The Gini Coefficient is a (descriptive statistic) measure of inequality with values ranging from 0 (complete equality) to 1 (complete inequality),
The computation is sensitive to the number of cases (people, countries, households, etc.)
Here are four hypothetical distributions of individual wealth and the computed Gini coefficients:
100 individuals
1 person gets 100% of all wealth
99 people get 0% of all wealth
Gini – .99 (extremely high inequality)
5 individuals
1 person gets 100% of all wealth
4 people get 0% of all wealth
Gini = .80 (very high inequality)
5 individuals
1 person gets 80% of all wealth
4 people EACH get 5% of all wealth
Gini = .60 (high inequality)
5 individuals
Each person gets 20% of all wealth
Gini =.00 (equality)
The numbers in the first column may look different from other tables of Gini coefficients you may have seen because it is measuring the distribution of wealth, whereas most often one sees Gini tables measuring (distribution of) income. As Arthur Wilke says, the higher the Gini, the greater the inequality.
The three other columns are:
– ratio of wealth of person at 90th percentile (bottom of top 10%) vs. wealth of median person (50th percentile). So an inequality comparison of wealthy to median. Again, higher is more unequal. According to the table, in the U.S. the person at the 90th percentile has 12.2 times the wealth of the median person.
– percent of total wealth owned by the bottom half of the population (bottom 50%). Here a smaller percentage means more unequal.
– percent of total wealth owned by top 5% of population. Higher is more unequal.
The U.S. data are mind-boggling but wealth distributions are highly unequal in all capitalist countries. The main point of the Piketty book everyone was talking about 2-3 years ago is that, except in rare periods, wealth inequality tends to increase over time. Michael Hudson’s point is similar: that without periodic debt jubilees or write-offs, the debt (negative wealth) of the non-wealthy tends to grow over time to a point where it makes the economy dysfunctional (and ruins lots of lives).
I thought TARP was all paid back + more, so we the taxpayers actually made out OK. I didn’t pay more tax, so what am I missing here?
Wikipedia – national debt of the United States. Midway through first section there are two charts that very clearly show national debt growing after 2008. I’m not complaining about debt mind you, but your steady taxes might be explained by deferred payments.
Maybe it’s the non-sovereigns that depend more on their taxpayers, as a bunch of the US debt was bought by the Fed.
https://fred.stlouisfed.org/series/TREAST
From an MMT perspective, that’s the government creating a whole lot of private assets (bonds issued by treasury) and putting them in private hands. The fed then purchased those for cash or acquired through a Repo transaction.
Unless you’re quite wealthy and well-connected, I suspect those assets haven’t made their way to you over the past decade. That’s certainly true for about 95-99% of us.
Steve Randy Waldman of Interfluidity explained this very nicely awhile back.
“Cash is not king in financial markets. Risk is.”
https://www.interfluidity.com/v2/2587.html
Also, what was loaned through TARP was a tiny fraction of what was done by the Federal Reserve. Holding the Fed Funds rate at zero for something like 5-6 years was estimated to cost the public $300-$400bn a year in lost interest on savings.
Lost interest as compared to what? Passbook savings have been passe’ for many years. What is the ‘normal’ interest rate?
https://www.macrotrends.net/2015/fed-funds-rate-historical-chart
And don’t forget these remittances to the Treasury:
https://www.crfb.org/blogs/feds-effect-deficits-and-debt
It appears you are too young to remember what even CDs paid before 2007.
In case you missed it, the US has had seriously negative real interest rates post crisis. It’s a monster tax on long-term investors, savers, retirees.
Blushing…
Yeah I’m plenty old enough.. lol
I remember 13-14% MMFs, and 19-20% 2nd deeds of trust back in the early ’80’s.
But I just haven’t put much money into CD’s, bonds and other such fixed income paper since the ’90’s. So you are correct in that I haven’t paid much attention.
Heck my MIL died a few years back and she had next to no fixed interest paying vehicles in her portfolio, save some dividend paying stocks.
What “risks” are the financial elite taking with bailouts around every corner and the purchase of the governments that have “legitimate” claims to violence?
Are they “risking” getting caught with all the fraud?
This is stunning considering it comes from Austrian economists. They refer to Oliver Blanchard as bemoaning the difficulties involved in actually defining wealth and poverty due to the necessity to run averages and use aggregates of classes of people, which are such blunt instruments; tsk, tsk. And they did not mention Blanchard’s secret agenda? Blanchard wants to keep the wealthy wealthy … by not allowing sovereign nations to spend into their economies for fiscal projects. Maybe Mr. Blanchard can explain. I also found the concept by these authors of the “different functions of wealth” to be at best evasive if not non nonsensical. But still, they came through in their conclusions that wealth is tantamount to well being and that’s how it needs to be managed. Or so I read this. My question would be this: Is it then possible and has it always been possible to establish an optimum level of the 3 variables (capitalists, owners and renters) of wealth to actively create a society to function for the benefit and well being of everyone? We do know, for instance, that “capitalists” need a lot of people for their economic foundation. Should those people be deprived of decent living? Perhaps something more than the “slight compression of the net wealth distribution” would help? And is it possible that selling stock/investments and trading them back and forth in some electronic frenzy disrupts all efforts to equalize society? Are we after profits or direct material well being?
I think the point about “different functions of wealth” was just a confusing way to say “housing wealth is not the same as capitalist wealth,” which seems like a fair point. Lots of analysis of wealth and wealth inequality is confounded by the fact that, for most people, equity tied up in their home is the only wealth they have (but when you aggregate housing wealth it is a very large number), and while housing wealth is nicer to have than not have, it serves a different point and purpose than capitalist (income-generating) wealth, even though that distinction does get muddled as housing values escalate.
It’s not immediately obvious to me that this article makes the point the authors want it to. For wage earners, preserving their employment is critical and for most of us that is impossible to do that without preserving (the business of) our employers. As the old saying goes, the only thing worse than being exploited in your work is not having any work in which to be exploited. In the absence of a job guarantee or major expansion of worker ownership or stock-for-gov’t equity infusions, all of which are nowhere to be found in the current crisis, preserving employers seems to be the best option on the table for working people. Though it is true that increasing concentration and inequality are likely outcomes.
Not sustainable when the worker’s self-preservation is also threatened by trying to keep the comfortable in comfort.
And it was one of the NC writers who has the mantra “housing is not wealth”.
There are more forever mortgage payers than home “owners.”
And you don’t know what something is worth until you try to sell it.
A thirty year mortgage, for example, resembles nothing so much as paying rent. Until over half way through the mortgage, the equity/wealth is very small. That equity plus the interest benefit the mortgage holder. The only way one realizes the “wealth” accumulated is through assets inflation. What is realized is a small return on money that from the owner’s/renter’s position has been idle, but from the mortgage holder’s position has been generating income. Once taxes, insurance, and maintenance are taken into account “Home owners” are actually renters.
That was…dense. I’ve got a few points where I’m not exactly sure I know what they’re saying (capitalists having “self-employed business income,” for instance), and a few quibbles with how they present the data (adding lines-of-best-fit to widely scattered data points), but for me the take-away point is valid, and it is this:
Using the power of the state to maintain the economic status quo will also maintain the class status quo, thus reinforcing the wealth and income inequalities in society. No real surprises there. The solution is “becoming an owner” for people now in the “renter” category. For me, of course, that means wide-scale conversion to worker ownership. Don’t offer bailouts to small business owners, offer buy-outs. The Feds could easily offer workers 0% interest, forgivable loans to buy their workplaces, and do it in such a way as to minimize the harm to workers in the event of subsequent business failure.
Rather than ‘dense’ I believe the words ‘obtuse’ and ‘obscure’ better characterize this post. I am not sure what to take-away from this post. It read to me ask if the authors wanted to make a point that they were very afraid to state plainly.
No, they are economists. This is how economists write unless they are the sort that write op-eds regularly.
Working for a public health agency I have tried for years to investigate the link between health and various socio-economic indicators. Of course, the government always obfuscates and pushes into the future any public release of meaningful cross-tabulations.
And as for getting to the wealth of people, my gosh, that is a fool’s errand. Information is of course available, the tax agencies (for income as well as residential properties) have it all. But the laws and/or “privacy issues” do not allow for linkages and analyses, even if were to be conducted in de-identified format.
If it were to involve a privacy commissioner, one would get the data but one wouldn’t be able to do any linkages…
an aside:
I think this Taibbi – RollingStone article makes the same points about the CARES Act , like the 2008 bailout, increases the wealth gap, as experienced from the perspective of ordinary people. The business/economic vicious cycle of the past 40 years continues, (with extra ‘viscious’ for most people).
https://www.rollingstone.com/politics/politics-features/taibbi-covid-19-bailout-wall-street-997342/
I don’t have a good understanding of what is going on in other countries — so I’ll stay focused on the US. The US CARES Act does not preserve wealth for the wealthy, and does not maintain a ‘status quo’. I believe it will greatly increase the relative wealth of Big Money and increase its power to control the Government and the lives of the Populace. This post wanders around GINI coefficients and constructs tables and draws charts waffling around a discussion of wealth effects as though wealth were solely in the hands of human individuals. The help for the Populace is a bad joke. The bailout and preservation of the wealthy is of concern though a relatively small part of the funding in the CARES Act. I am far more concerned about the bailout and lines of credit extended to our Corporate Cartels and Big Money Banks. I view the CARES Act as a credit card Big Money’s Government proffered to Big Money to support a buying spree post Corona for grabbing up the many bargains made available by the CARES Act songs of support for the Populace and the merely wealthy owners of small and medium business.
Discussions of the economic impacts of Corona policy across nations will inherently devolve into meaningless statistics, charts, and graphs and obscure findings rivaling the least sage predictions of the Sibyls. Each country will be impacted differently depending on too many variables to make any more perceptive analysis than to assert there will be “wealth effects” and it looks like the wealthy will make out like bandits, and Big Money will consolidate greater power.
If the economy collapses, it will be because the American everyman consumer decides to save and hoard money: https://www.marketwatch.com/story/the-us-economy-is-facing-a-new-threat-consumers-are-being-too-responsible-with-their-money-2020-05-13?mod=home-page
The billionaires not spending their billions will just be innocent bystanders and victims.
ha! good one. ;) (and pay no attention to millions of savers and pensions losing billions in foregone interest earnings in a near zero-interest rate environment. all to save Wall St. of course.)
Japan led the way and everyone followed.
At 25.30 mins you can see the super imposed private debt-to-GDP ratios.
https://www.youtube.com/watch?v=vAStZJCKmbU&list=PLmtuEaMvhDZZQLxg24CAiFgZYldtoCR-R&index=6
What Japan does in the 1980s; the US, the UK and Euro-zone do leading up to 2008 and China has done more recently.
Richard Koo had studied what had happened in Japan and knew the same would happen in the West after 2008. He explains the processes at work in the Japanese economy since the 1990s, which are at now at work throughout the global economy.
https://www.youtube.com/watch?v=8YTyJzmiHGk
Debt repayments to banks destroy money, this is the problem.
https://www.bankofengland.co.uk/-/media/boe/files/quarterly-bulletin/2014/money-creation-in-the-modern-economy.pdf
Japan saved the banks, but left the debt in place.
This did avoid a Great Depression type event, but you get a balance sheet recession instead.
We copied Japan again, and this is why Western economies have been so sluggish since 2008.
Debt repayments to banks destroy money, this is the problem.
Austerity is the worst thing you can do in a balance sheet recession.
QE can’t get into the real economy due to a lack of borrowers.
The banks are ready to lend, but there are too few borrowers as they are struggling with the debt they have already taken on.
QE can get into financial markets, so the gap between the markets and economic fundamentals widens and by 2019 it was at 1929 levels.
The wealthy own most of the financial assets, whilst the average person is relying on earned income from the real economy.
Inequality gets worse.
Richard Koo studied the Great Depression and this is why Japan maintained the money supply with Government borrowing and spending.
Debt deflation is caused by a shrinking money supply.
The money supply ≈ public debt + private debt
Japan used fiscal stimulus to maintain the money supply as they deleveraged, and reduced the “private debt” component of the money supply
They didn’t do much QE as they knew it could not get into the real economy.
Kuroda started doing lots of QE and Richard Koo has put this down to him having no central bank experience.
Personally, I think Kuroda knows what he is doing and is using QE to inflate asset prices.
This is what QE does best.
Richard Koo studied the Great Depression and this is why Japan maintained the money supply with Government borrowing and spending.
The Americans didn’t do austerity because Ben Bernanke had read Richard Koo’s book.
In Europe, no one really knew what they were doing.
Greece was plunged into a Great Depression type event by the Troika.
The IMF predicted Greek GDP would have recovered by 2015 with austerity.
By 2015 Greek GDP was down 27% and still falling.
The money supply ≈ public debt + private debt
The “private debt” component was going down with deleveraging from a debt fuelled boom. The Troika then wrecked the Greek economy by cutting the “public debt” component and pushed the economy into debt deflation (a shrinking money supply).
Richard Koo studied the Great Depression and this is why Japan maintained the money supply with Government borrowing and spending.
Debt deflation is caused by a shrinking money supply.
The money supply ≈ public debt + private debt
Japan used fiscal stimulus to maintain the money supply as they deleveraged, and reduced the “private debt” component of the money supply
A private debt problem became a public debt problem.
Adair Turner has built on Japan’s experience.
https://www.youtube.com/watch?v=LCX3qPq0JDA
His answer is Government created money.
The money supply ≈ public debt + private debt
You can maintain the money supply while paying down the overall debt as both private and public debt are too high already.
For MMT people.
As Randall Wray has said, what we call Government debt is the debt issued as a Government bond.
The other type of debt isn’t really that important and that is why it isn’t included in the figures.
The Positive money people just ignore it altogether as it doesn’t really matter much.
MMT is more precise.
The two different ways of looking at it don’t actually make that much difference in the real world.