By rjs, a rural swamp denizen from Northeast Ohio, and a long-time commenter at Naked Capitalism. Originally published at MarketWatch 666.
In this post, I respond to concerns raised about the consumer credit report in two posts that were included in Naked Capitalism links this week, and find that consumer credit gains in May were not imaginary, and that the seasonal adjustment process did not significantly distort the results; then, in the May Mortgage Monitor from LPS, we’ll see that although delinquencies and foreclosures continue to decrease, the average time that those delinquent remain in their homes without foreclosure and the average length of time that those in foreclosure remain in the process without their homes being seized continues to lengthen. Finally, we’ll look at May job openings and job turnover and find not much has changed since April.
May’s Consumer Credit
It’s been a relatively slow week for economic releases, with only reports on wholesale inventories and prices and an almost unchanged report on May job openings reported, in addition to the regular weekly releases, which can be quite noisy. However, there seems to have been some confusion in the financial press as to the significance of the May report on Consumer Credit from the Fed, which resulted in headlines with as wide ranging differences as "Consumer Borrowing in U.S. Rises $19.6 Billion, Most in Year" to "May 2013 Consumer Credit Growth of 8.25% Is Imaginary". There’s also been some concern that the Fed’s seasonal adjustment process may have inflated the reported credit expansion.. So maybe we should dig a bit deeper into this release and the historical data available to find out what really happened in May, and how it compares to what has happened previously.
 Let’s start by reviewing what was reported. According to the Fed, seasonally adjusted aggregate consumer credit increased by $19.6 billion, from $2,819.7 billion in April to $2,839.3 billion in May, which they figure to be at an annual rate of 8.3%. By the same reckoning, the revolving credit subset, which mostly represents credit card borrowing, rose $6.6 billion from $849.9 billion in April to $856.5 billion in May, which would be at a seasonally adjusted annual rate of 9.3%, while non-revolving credit, which is longer term borrowing for major items such as cars, yachts, and tuition (but not real estate), rose $13 billion from a seasonally adjusted $1,969.8 billion in April to $1,982.8 in May, or at an annual rate of 7.9%. Our adjacent FRED graph shows the seasonally adjusted annualized change in revolving credit in red, non-revolving credit in green, and the aggregate monthly change in blue since January 2011. Now those increase percentages are annualized, such as we’ve seen in other reports such as GDP and housing. If the jobs report was reported this way, you’d see a report that 2 million jobs were created in June at an annualized rate.. However, if we do the math, we see the increase in the aggregate credit from April to May was 0.695%, while revolving credit rose 0.777% over the month, and non-revolving credit increased 0.657% from April to May…
Now, those are also seasonally adjusted numbers, as computed by a program which adjusts each month’s data from the actual month to month changes to what it would be versus the historical change for that month, something that’s done with every economic report, because otherwise seasonal factors would render the data useless for comparison purposes (ie, every year there’d be job growth in November before the holidays & job losses in January). So what are the actual month over month changes in consumer credit? As shown in the excerpt from table 2 from the report included below, the unadjusted change in revolving credit was from $807.6 billion in April to $816.6 billion in May, a $9.0 billion increase, while the unadjusted increase in non-revolving credit was from $1,968.6 billion in April to $1,979.1 billion in May, a $10.5 billion increase. What this means is that the seasonal adjustment decreased the reported revolving credit change, and increased the non-revolving credit change, suggesting that May is historically an above average month for credit card use, and below average for longer term borrowing for such auto & student loans. However, the change in total credit is virtually the same as the reported $19.6 billion seasonally adjusted increase; so the overall increase in May consumer credit was not altered significantly by the seasonal adjustment process.
Next notice that the unadjusted total of $2795.7 billion of consumer credit outstanding at the end of May is $43.6 billion lower than the reported seasonally adjusted total of $2,839.3 billion, but the 2012 year end total of $2768.1 billion is identical in both the seasonally adjusted totals and the unadjusted totals. That means that seasonally adjustment process boosted reported credit expansion for the first four months of the year. We can see most of the reason why in the unadjusted decrease from $845.8 billion year end revolving credit outstanding to the 1st quarter revolving credit total of $804.9 billion; the seasonal adjustment process boosted the unadjusted number by $44.2 billion to $849.1 billion, $3.3 billion higher than the year end total.. What the seasonal adjustment is allowing for here is the normal fall off of credit card use during the first three months of the year, when many consumers are already overextended from holiday shopping. What that seasonal adjustment process will continue to do between now and the end of the year will be to reduce the reported borrowing during those months where it is above normal, most likely when student borrowing peaks in the fall, and during the November and december shopping seasons..

Now, let’s compare the historical change in adjusted and unadjusted credit expansion from April to May over the past few years. The seasonally adjusted increase from April to May 2012 was $19.9 billion; for April to May 2011 it was $8.4 billion, and for 2010 it was a decrease of $10.1 billion The actual, unadjusted change in consumer credit outstanding from April to May for those years was + $19.8 billion in 2012, + $8.6 billion in 2011, and minus $9.2 billion in 2010. Since seasonal adjustment algorithms give a heavier weighting to more recent years, that contraction of consumer credit in May of 2010 may have slightly inflated subsequent May reports, but judging by the differences noted, not by much.

Since we have that table of unadjusted consumer credit above, let’s check out a few other trends that we can glean from it. Notice that we have year end totals for both revolving and non-revolving credit; it’s obvious that outstanding revolving credit, or credit card debt, shrunk from $1005.2 billion in 2008 to $840.7 billion in 2010 and has barely recovered since. Meanwhile, non revolving credit has increased from $1520.7 billion in 2008 to $1979.1 billion in the recent month. But look at each of the line items under non-revolving credit, which represent the major holders of that debt, and you’ll note that longer term borrowing from banks, finance companies, and credit unions has barely budged. It’s only borrowing from the federal government, in the form of student loans, which has driven credit expansion over the last five years.. Indeed, over the four years from year end 2008 to year end 2012, consumer debt held by the federal government has increased more than fivefold, from $104.3 billion in 2008 to $526.8 billion in 2012, and is now the largest asset on the government balance sheet, More importantly, were it not for the $422.5 billion in student loans doled out by the federal government over those four years, net consumer credit would have contracted by $180.3 billion over the period. We’ve inserted a small FRED graph showing the historical growth of consumer loans owned by the Federal government; there’s no need to enlarge that to see the trajectory…
LPS Mortgage Monitor
The Mortgage Monitor for May (pdf) from LPS (Lender Processing Services) is a monthly report we continue to cover, even though it’s rarely mentioned in the financial press, because it’s really the only report that gives us an accurate picture of the condition of all the mortgages in the US and of the ongoing mortgage crisis on a monthly basis. Note that although the Mortgage Delinquency Survey from the Mortgage Bankers Association covers some of that same data, it’s only issued quarterly, but since the comparisons are very close (MBA shows slightly higher delinquencies), it confirms the verity of the monthly LPS data…
 According to LPS, 4,469,000 mortgages, or 9.13% of all first lien mortgage loans, were at least one payment delinquent at the end of May; that’s down from of 4,699,000 that were delinquent at the end of April, and down from the 11.08% of mortgages that were past due a year earlier. Of those overdue mortgages, 1,525,000 mortgages were in the foreclosure process, another 1,335,000 mortgages were 90 or more days delinquent, but not in foreclosure, and 1,708,000 more loans were over 30 days and less than 90 days past due, but not in foreclosure. The 3.05% of mortgages in foreclosure at the end of May was down from 3.17% at the end of April and down from the 4.17% in foreclosure a year earlier, while the 6.08% that were delinquent but not in foreclosure was down from April’s 6.21% and the 6.91% delinquency rate of May a year ago. 116,812 foreclosures were started in May, compared to 127,496 in April and in contrast with the 218,900 foreclosure starts in May of 2012. This slowdown in foreclosure activity was confirmed in another release this week from RealtyTrac, who reported a total of 801,359 U.S. properties with foreclosure filings of all types in the first half of 2013, 19% lower than the last half of 2012 and the lowest since 2006…
Since most of the data in this 31 page pdf report is graphically presented, we’ll select a few to include here with explanations; click any for an enlargement. Our first graph above, from page 4 of the mortgage monitor pdf, shows in green the percentage of active home loans that have been in the foreclosure process from 1995 to the present; these are those mortgages against which the servicer has initiated the foreclosure process but has not yet seized the home through a foreclosure sale, which typically transfers the ownership of the property to the bank. Although this foreclosure inventory is at the lowest of the crisis at 3.05% of all mortgages, it’s still 5.7 times greater than the average foreclosure inventory of the 1995 to 2005 period. The above graph also tracks the percentage of loans that have been delinquent monthly over the same period in red. Although the delinquency rate of 6.08% of active loans has fallen from a crisis high of 10.57%, its still 1.4 times the average delinquency rate of the ’95 to ’05 period.. Also note the seasonally of delinquencies in that red track; typically, some homeowners forgo a house payment or two as children return to school or as the holidays approach (or when a new iphone is released); then start to catch up on mortgage payments after the holidays, so invariably the delinquency rate falls over the first 3 months of each year, which it did even at the height of the crisis…although the 15% year to date decline in mortgage delinquencies this year is the largest year to date seasonal decline since 2002, we would not be surprised to see delinquencies increase again in the coming months…

Our next graphic is from page 6 of the mortgage monitor pdf, and it illustrates the ongoing lengthening of the seriously delinquent and foreclose timeframes The violet line starts in 2005 and tracks the average number of days seriously delinquent properties have remained more than 90 days past due without foreclosure action.. As of May, the average length of time that a seriously delinquent mortgage has gone without making current house payments is now at 511 days, up from 503 last month (the data for this chart is on page 20 of the mortgage monitor, and also here). The red line tracks the average number of days that homes in the foreclosure process have remained in limbo without being seized, and that’s now up to 852 days. Obviously, as we’ve seen, the total foreclosure inventory has declined over the past two years, but for some of those homeowners that have entered the process, especially in judicial states where the right to foreclose must be established in court, the process continues to drag on with no end in sight. Since the average of 852 days in foreclosure includes at least several hundred thousand homes that have entered into foreclosure in the past year, it’s a safe guess there are at least as many that have been in foreclosure for over four years.

The third graphic we’ll look at is from page 16 of the mortgage monitor pdf and it shows the percentage of home mortgage loans that became delinquent within 12 months of purchase by year, and the weighted average credit score for mortgages originated in each year. Although not included on this bar graph, LPS notes that the weighted average credit score for 2013 originations is 754.. While LPS includes this graphic to show how recent vintage mortgages with pristine credit quality have continued to perform, what is surprising here is the percentage of new homeowners that were already behind on their house payments in 2006 and 2007, before the serious housing bust and higher unemployment rates took hold.. It’s clear that late in the housing boom, a significant number of people were being put into mortgages that they were apparently unable to keep up with payments on. You can click on this graph, or any graphic here, for a larger view…
The final plate from the mortgage monitor that we’ll include here is from page 19, and it is a table of non-current mortgage percentages in all 50 states and the District of Columbia. The first column is the delinquency rate for each state, or the percentage of mortgages in each state that are at least one month behind and not yet in foreclosure. The second column is the percentage in each state that are in foreclosure, and the third column is the total non-current percentage, or sum of the first two. The last column is the year over year percentage change in non current mortgages in each state. Note that judicial states, where banks must establish their right to foreclose in court, are marked with a red asterisk. These states have the highest percentages stuck in foreclosure, led by Florida, where one in ten mortgaged homes were in foreclosure as of the end of May. Other judicial states with a foreclosure inventory greater than 5% include New Jersey at 7.1%, New York and Hawaii at 5.8%, and Maine at 5.4%, whereas Mississippi’s presence high on the non current list is mostly due to the 11.9% of their residents who are one or more than one payment behind on their mortgages.

JOLTS
Finally, 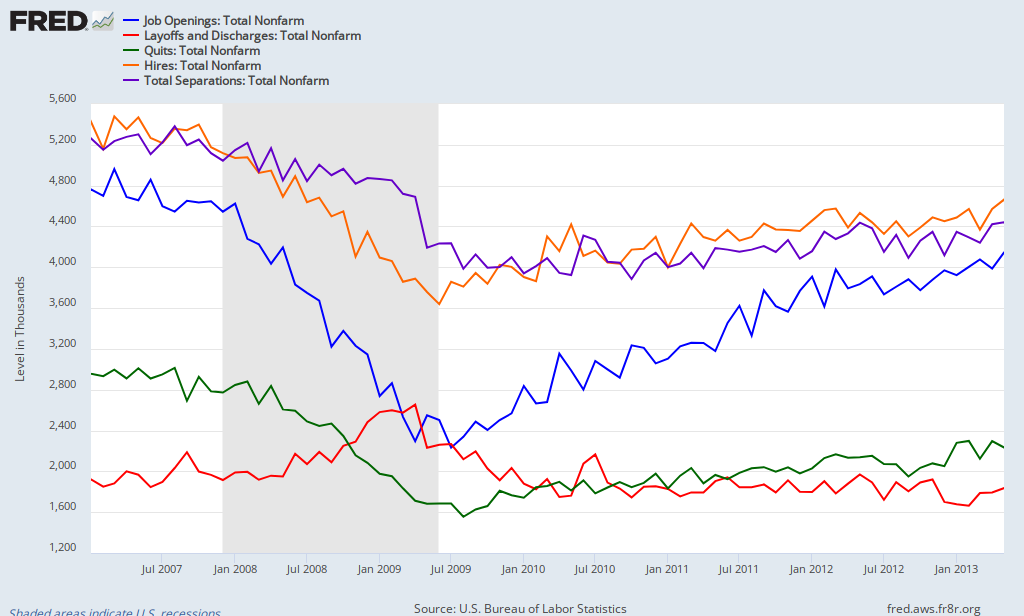 we’ll also take a look at some of the innards of the Job Openings and Labor Turnover Summary for May from the BLS, which uses the phrase "little changed" four times and "essentially unchanged" once in the first three paragraphs. In one of those little changed metrics, seasonally adjusted job openings rose from 3,800,000 in April to 3,828,000 in May; that’s 2.7% as a percentage of total employment and that is unchanged. There were 3.1 officially unemployed for every job opening in May, and that was also unchanged, and if you include those who are part time who want a full time job, the ratio is 5.7 workers for each job opening. Job openings in retail rose from 455,000 to 537,000 while job openings in professional and business services fell from 731,000 to 628,000. Job openings in the Midwest rose from 805,000 to 886,000, increasing openings as percentage of total employment in the region from 2.5% to 2.8%, while job openings in the West declined to 789,000 from 831,000, resulting in a 0.1% downtick to 2.6% in the openings rate.
labor turnover consists of hires and job separations, and the difference between them should be equal to the total change in non-farm payrolls as reported by the establishment survey of the jobs report. There were 4,441,000 hired to start new jobs in May, which was up slightly from 4.395,000 million hired in April, while the hiring rate as a percentage of all employed rose from 3.2% to 3.3%. Jobs in retail saw the largest increase in hiring, from 598,000 to 625,000, while hiring in professional and business services slipped from 912,000 in April to 870.000 in May. Hires, which include rehires and callbacks from layoffs, rose from 952,000 in April to 1,027,000 in May in the Midwest while they fell from 981.000 to 945,000 in the West. Total separations in May were also up a bit, to 4,323,000 from 4,287,000 in April, while the separations rate as a percentage of total employment remained unchanged at 3.2%. Hires minus separations equals 118,000, far short of the revised 195,000 non-farms payroll figure for May reported last week, so one of these BLS reports is off by a bunch. The greatest increase in separations was seen in manufacturing, where 247,000 were either fired, laid off, quit or retired, vs 224,000 manufacturing workers separated from their jobs in April. Separations increased in the Midwest, from 924,000 to 987,000, increasing the separations rate from 3.0% to 3.2%, while separations fell in the west, from 1021,000 to 934,000, reducing their separations rate from 3.4% to 3.1%..
Of May job separations, 2,203,000 quit their jobs, up from 2,185,000 in April, leaving the quits rate unchanged at 1.6%; the only increase in quits was in the South, where 945,000 left their jobs in May vs 918,000 in April. The quits rate is watched as a sign of worker confidence, and it’s been "little changed" all year. Another 1,549,000 were either laid off, fired or otherwise discharged in May, for a layoffs and firings rate of 1.3%. 356,000 of those were in professional and business services, but discharges were down from 467,000 cut from those jobs in April. Other separations, which includes retirement and death, numbered 382,000, for an ‘other separations’ rate of 0.3%….Our FRED graph for this report, above, shows monthly job openings in blue since January 2007. Total hires monthly is shown in in orange, while the track of total separations is shown in purple. Of the two major components of separations, layoffs and firings are tracked in red, while the number of those quitting their jobs monthly is shown in green..


the states table of non-current mortgages has the last column cut off; i sent lambert a fix to downsize it to fit, but in the meantime you can just click to enlarge it, which will get you the full view…
Done.
Crunching some numbers last night on pending sales in our area, and the data was interesting. From the last week of June to the first week of July, pending sales of single family homes dropped about 8 percent from one week to the next. Interestingly it looks like the overall pending index will still show a slight increase into the first week of July. So where did the gains come from? They decided to rent a home! Pending indexes for multi-family and rentals were up by 40% in one week! Single family, condos, townhomes….all lower.
For all those cheerleaders who suggest that higher mortgage rates won’t affect the housing recovery, the data suggest otherwise.
http://aaronlayman.com/2013/07/pending-sales-of-single-family-houston-homes-decrease-with-recent-spike-in-mortgage-rates/
Now this is an interesting stat:
Not sure what the implications of that are (aside from the “not dischargeable in bankruptcy” part (thanks to Joe Biden, the workingman’s friend!))