Yves here. The mainstream financial media has been openly skeptical of the latest US inflation report, as these headlines demonstrate. First from the Wall Street Journal:


Wolf Richter explains the data fudge that the BLS used, and how it started before this inflation report.
Keep in mind that this sort of statistical manipulation is not just bad in itself, by among other things leading to deliberately setting inflation adjustments too low and producing an overstatement of GDP. It’s the sort of thing that occurs in pre-financial crisis periods, when the officialdom puts its finger on the dial to keep the party going. In the runup to the financial crisis, analysts like Michael Shedlock and Barry Ritholtz called out the “birth/death adjustment” to jobs creation data, which the BLS adds to allow for the fact that its survey doesn’t capture the creation or failure of businesses which too often were unusually large and increased the level of reported gains. In 2007, we included bogus official statistics on a list of Banana Republic Indicators. Readers can add to this list:
Compounds with private security for the very rich
Limited economic/class mobility
Militarization, exaggeration of external threats
Very high concentration of income and asset ownership in the very top echelon
Government policies heavily skewed towards the very rich; looting of the treasury
Limited/no press freedom
Election fraud; in extreme versions, coups, one party rule
Attacks on judicial independence/kangaroo courts
So this data chicanery may seem penny-ante taken in isolation, but it’s yet another indicator of continuing US decline.
By Wolf Richter, editor at Wolf Street. Originally published at Wolf Street
The Bureau of Labor Statistics explained today in its CPI report for November that most data for October was missing and some data for November was missing, and that it filled in the gaps in the November data, including by “approximating missing data points” with whatever, including for Owners Equivalent of Rent (OER), the biggest component of CPI, weighing 26% of overall CPI, for 33% of core CPI, and for 44% of core services CPI.
OER had a suspicious outlier-plunge in September, and that suspicious outlier-plunge in September was carried forward to October and November. And the BLS even explained some of it in separate notes, and so it’s not a secret.
This is a screenshot of the CPI summary table. You can see that nearly all the entries for month-to-month changes in October and November are missing. The exceptions are the entries for which BLS relies on “nonsurvey data,” such as gasoline prices and new and used vehicle prices (it purchases the vehicle data from J.D. Power).
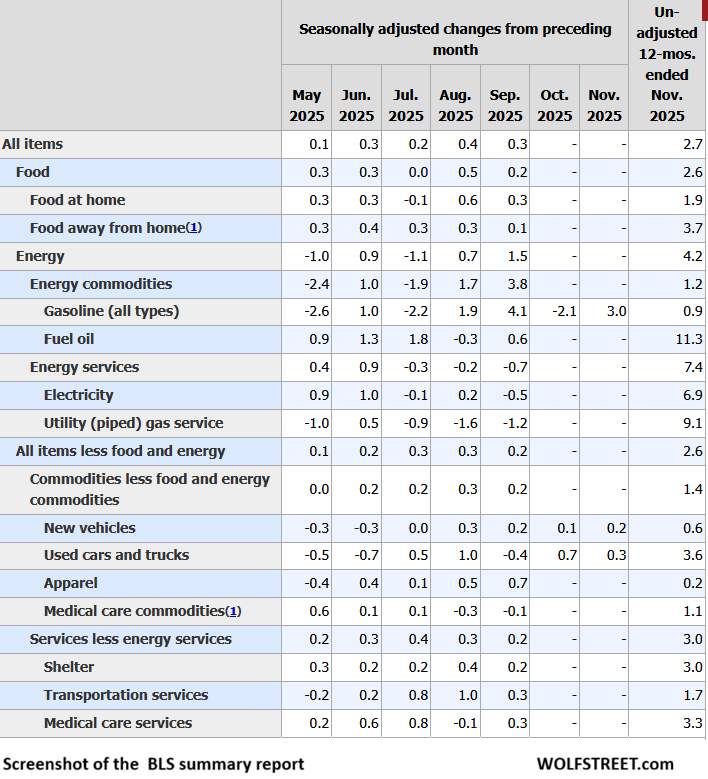
What BLS Said About the Missing Data and How It Dealt With It
In its summary report, BLS said: “BLS did not collect survey data for October 2025 due to a lapse in appropriations. BLS was unable to retroactively collect these data. For a few indexes, BLS uses nonsurvey data sources instead of survey data to make the index calculations. BLS was able to retroactively acquire most of the nonsurvey data for October. CPI data collection resumed on November 14, 2025.”
In a separate note, BLS briefly explained some of the other shortcomings of this CPI release.
“What was the impact on November data collection? Collection began on Friday, November 14. By authorizing additional collection hours, BLS attempted to collect data for the entire month of November.”
It said “attempted to collect.”
And this is a bad joke: “How were November indexes calculated? November 2025 indexes were calculated by comparing November 2025 prices with October 2025 prices.” But October prices don’t exist in the data… “BLS could not collect October 2025 reference period survey data, so survey data were carried forward to October 2025 from September 2025 in accordance with normal procedures.”
In other words, BLS just made up the October data.
And the September data, which was used as base for the made-up October data, was marred by the total outlier plunge of OER, which accounts for 26% of overall CPI, for 33% of core CPI, and for 44% of core services CPI. And that outlier plunge in September was carried forward to October and November.
Specifically about OER: “BLS calculates rent and owners’ equivalent rent using six-month panel collection [surveys are sent to the same address every six months, instead of every month].
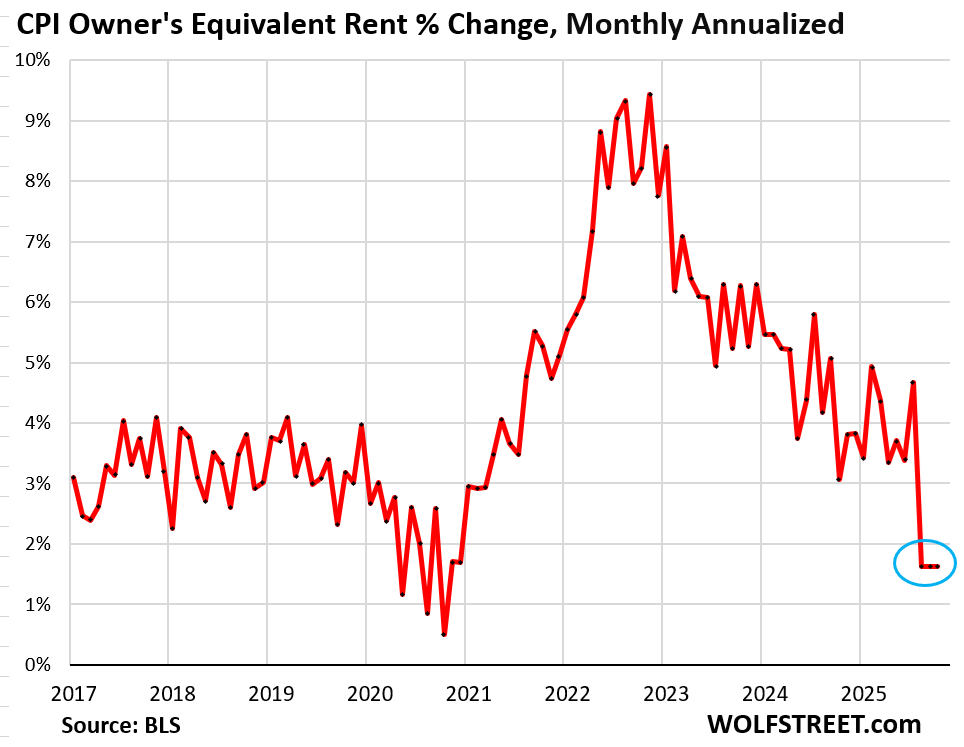
So there was this suspicious outlier drop in September, and rather than bouncing back, as it should have done, it was carried forward to October and November, making for one heck of a funny chart below.
Using the BLS index data for OER as provided today…
Aug: 430.69
Sep: 431.27
Oct:
Nov: 432.44
…this is what the now clearly doctored OER looks like, month-to-month percentage change, annualized. It has been at an annualized rate of 1.6% for the past three months, compared to an average 4.1% in the six months before the doctored September. That’s a sudden 2.4 percentage-point plunge out of nowhere for the third month in a row.
And this doctored component is 26% of overall CPI, for 33% of core CPI, and for 44% of core services CPI, turning the entire CPI data into a bad joke  or worse
But It’s Not a Bad Joke, It’s Much Worse
Lots of things depend on CPI, including the calculation of the “inflation protection” in Treasury Inflation Protected Securities (TIPS), I-series savings bonds the government sells to retail investors, Social Security COLAs, and other inflation adjustments paid to investors and beneficiaries, and they will all be underpaid for inflation.
This data here also impacts broader economic data that is adjusted to inflation, including “real” consumer spending and “real” GDP because the BEA, which produces those overall economic indices, uses some of this CPI data, including OER, for its calculation of the PCE price index and the GDP deflator, among others.
BLS is now causing serious issues with all of them, with investors and beneficiaries getting short-changed on their inflation protection, and with inflation-adjusted economic data getting inflated, which would, of course, suit the administration’s narrative.


Yves/NCers, do you have a guesstimate of what the X actual CPI inflation should be, versus this bogusfied reported 2.7%?
In big-box shopping I am surprised to see a price not increased in the preceding month or so, usually an increase of at least 10 percent once or twice a year. So even the estimates accepted by economists apparently do not reflect consumer price increases. The real consumer inflation rate exceeds 10 percent.
If you use the 6-mo average OER to estimate oct and nov rather than just September, overall inflation would be 3.2 percent.
This would still use September’s suspicious outlier drop, but its weighted much lower
not defending the OER….but supposedly X (1? 1.5?) *million* migrants have left the country.
then throw in multi-generational living.
surely that is showing up somewhere in marginal demand?
Stupid Question: do borrowing costs count as part of OER?
No. As Conor has discussed at length in his work on landlord rent-fixing schemes. they will keep apartments off the market to keep rents up.
And many illegal immigrants live in overcrowded housing, often over 10 per apartment, so the fall in migrant numbers would not produce a corresponding drop in vacancy rates.
Ugh most rentals in the U.S. is based on the old retirement scheme born out of the late 80s/90s on leveraged loans via Calif Orange Coast model [see Black] that went National. Whole nation of investors in stuff that had no rights too assets but, the financial vig, call it Capitalism.
Can’t back out now or VoM goes poof …
They have been manipulating the CPI for many, many years. My favorite trick is the substitutions they are allowed to work into the data. For example if steak goes from $10/lb to $15/lb, and ground beef goes from $7/lb to $10/lb, well you can still buy a beef product for $10/lb so there has been zero inflation, and therefore no need to raise the COLA for social security.
Credit where credit is due – at least they are developing new data manipulation techniques with this OER stuff!
Right? Like you can get 10 cans at least of fancy feast for what a can of tuna goes for…
Uh, there are 4 uncooked beef subcategories, so this particular example is simply wrong. They are ground beef, roasts, steaks and other including veal. Cooked products (“frankfurters” and “lunchmeats”) are separate. Ditto multiple categories of chicken, pork, and so on. As to beef prices, the subcategories are YoY +14.9%, 21.2%, 14.7% and 15.5% with “Beef” overall +15.8%.
More generally, since it’s not feasible to collect information on every item, at some point averages (typically geometric averages) are used to calculate the reported category. You can find a wealth of detail on methodology on the BLS site.
The real challenge is housing. Pre-retirement I regularly used Japanese data (I read Japanese…), their methodology is likewise problematic. Rents are one thing, at least in principle they are observable, but owner-occupied housing is really hard, and in both Japan and the US the share of owner-occupied housing is high.
Over time errors from a missing month or two disappear under the weight of new data, but (as the article notes) that doesn’t help with short-term inflation-adjusted prices, eg TIPS. It can also interact with things reset only once a year, though the annual Social Security reset predated the government shutdown. Of course that uses CPI, but not the experimental CPI for Americans Aged 62 and Older (the R-CPI-E data series).
However, it’s important to separate inflation from affordability. We can have a drop in rents sufficient to generate aggregate CPI deflation without my (rural) community, indeed most of the US, having affordable housing for the ALICE community, the working poor. (ALICE = Asset-Limited, Income-Constrained, Employed) If you graduate from high school so have no rental track record and have just started working full-time, so don’t have 2 months deposit saved up, you either remain with family or, if kicked out of the house, become homeless. Or end up finding a decrepit place up in a hollow somewhere, maybe an old single-wide, and have a long commute that eats up your takehome so that you can’t build up savings towards a deposit. Oh, and in most of the US, there’s no public transportation, and so getting around eats up a lot of your budget. Neither were problematic when the US “poverty line” was established, so it uses the cost of food. Now both housing and transportation (and if you have young kids or are old or unlucky, healtcare) costs dominate budgets, so after taking those out of your budget, being officially non-poor doesn’t mean you can afford food. The “poverty line” is a painfully anachronistic concept.
It seems to me it’s this sort of chicanery which has led to the virality of Michael Green’s recent Substack posts at “I give a fig” though those are about the official poverty rate rather than the CPI. What they have in common is increasingly widespread disbelief in official statistics of many kinds.
No bueno …